

Website ROI is: (revenue attributed to the site minus total website cost) divided by total website cost. That’s the whole formula. What takes work is defining “revenue attributed to the site” correctly and tracking it without guessing.
Start this week with three moves. First, install Google Analytics 4 (GA4) and Google Tag Manager (GTM) if they aren’t already running. Second, map and name every revenue event that matters, purchases, form submissions, phone clicks, so they show up as distinct data points rather than one blurry “conversions” number. Third, capture a baseline measurement window before you change anything, so later comparisons mean something.
- Install GA4 + GTM (or confirm they’re configured correctly)
- Name your revenue events: purchase, form_submit, phone_click
- Lock in a 30 to 90 day baseline before touching design or copy
Pro Tip: Don’t skip the baseline. Businesses that redesign a site without a “before” number end up arguing about impact instead of proving it, and Webby Website Optimisation sees this constantly with new clients who wish they’d tracked sooner.
Key Takeaways
Website ROI comes down to attributing real revenue events accurately, subtracting the full cost of running the site, and remeasuring after every change you make.
| Point | Details |
|---|---|
| Use the core formula | ROI = (attributed revenue − total website cost) ÷ total website cost, tracked over a defined window. |
| Track the right metrics | Conversion rate, revenue per visitor, AOV or lead value, and CPA feed the calculation directly. |
| Choose an attribution model deliberately | Last-click, first-click, and multi-touch models each assign revenue differently, pick one and stay consistent. |
| Expect a realistic payback window | Well-built business sites often see 6 to 18 months payback with 2 to 5% conversion rates. |
| Get expert setup and CRO support | Webby Website Optimisation configures GA4, GTM, and CRM tracking so ROI reporting reflects real revenue, not guesswork. |
Where to Learn More About Website ROI Tools and Benchmarks
For further reading beyond this guide, these sources go deeper into calculators and benchmarks:
- Smashing Magazine’s free ROI calculator
- Stackzeno’s measurement benchmarks
- Utsubo’s redesign ROI models
- Constant Contact’s ROI tracking guide
- ytechnology’s payback and profit calculator
Core tools worth installing regardless of which guide you follow: GA4, Google Tag Manager, HubSpot (or your CRM), and Hotjar or Microsoft Clarity for behavioral insight.
This article is general information, not a substitute for advice from a qualified financial advisor. Consult a qualified financial professional about your own circumstances before acting on anything here.
Table of Contents
- What Does Website ROI Actually Measure?
- What Metrics Feed the ROI Calculation?
- How Do You Calculate Website ROI Step by Step?
- Which Attribution Model Should You Use?
- What Tools and Calculators Simplify ROI Tracking?
- How Do You Improve Website ROI Once You’re Measuring It?
- How Often Should You Measure Website ROI?
- What Does the Research Say About Realistic ROI Expectations?
- What Actually Moves the Needle for Local Service Businesses?
- Get Help Measuring and Improving Your Website’s Return
- Sources
What Does Website ROI Actually Measure?
What counts as “return” depends entirely on your business model. An ecommerce store can point to a transaction and say, with confidence, that the website generated $4,200 last month. A service business selling $8,000 contracts has to work backward from a form submission to a closed deal weeks later.
- Ecommerce: direct, attributable transactions. Revenue equals the sum of completed purchases tied to site sessions.
- Lead generation/services: leads, calls, and bookings mapped to an average customer value, then multiplied by how many actually close.
- Content/brand sites: indirect influence, think a prospect who read three blog posts, then called the office because a coworker recommended you. That’s real value a last-click report will miss entirely.
The indirect category is where most owners undercount. If someone searches your brand name after seeing an ad, then converts organically, the site still did the work. Treat that as assisted revenue, not zero.
What Metrics Feed the ROI Calculation?
Seven numbers do most of the heavy lifting. Track them consistently and the ROI formula practically fills itself in.
- Conversion rate (macro: purchases/leads; micro: add-to-cart, email signups) — found in GA4’s Engagement reports.
- Revenue per visitor (RPV) — total revenue ÷ total visitors, the single cleanest efficiency number you can report to a CFO.
- Average order value (AOV) or average lead value — total revenue ÷ number of transactions or leads.
- Traffic by channel — organic, paid, direct, referral, so you know which channel is actually paying for itself.
- Assisted conversions — GA4’s attribution reports show which touchpoints contributed before the final click.
- Cost per acquisition (CPA) — total spend ÷ number of acquisitions.
- Lifetime value (LTV) — average customer value across their full relationship with you, not just the first sale.
For context on what “good” looks like: Stackzeno’s benchmarking guide puts realistic conversion rates for many business sites at 2 to 5%, with a payback window of roughly 6 to 18 months for a well-built site. If your numbers sit outside that range, that’s a signal worth investigating, not necessarily a crisis.
How Do You Calculate Website ROI Step by Step?
Follow this sequence, and you’ll get a number that survives a conversation with your accountant.
- Define your measurement window. Thirty days minimum; 90 is safer for lower-traffic sites.
- List every cost. One-off build fees plus ongoing hosting, content production, staff time, paid ads, and any software subscriptions. Zudro’s ROI methodology makes the point clearly: leaving out staff time or plugin fees inflates ROI artificially.
- Define and tag revenue events in GA4 so each one is attributable and named.
- Calculate total conversions and average value per conversion.
- Run the formula: (revenue − cost) ÷ cost, then convert to a payback period in months.
Ecommerce example: A site generates 140 transactions at a $95 average order value in a month, that’s $13,300 in revenue. Monthly costs (hosting, ads, maintenance) run $2,100. ROI = (13,300 − 2,100) ÷ 2,100 = 5.33, or 533%. If the original build cost $8,000, that’s paid back in well under a month at this run rate.
Lead-gen example: A B2B site produces 40 leads a month. Attributed revenue: $28,000. Marketing and maintenance costs: $4,000.
Which Attribution Model Should You Use?
The attribution model you choose changes the revenue number, sometimes dramatically, even when nothing else about the business changes.
- Last-click credits whichever channel got the final click before conversion. Simple, but it overrates paid search and underrates content that built early awareness.
- First-click credits the very first touchpoint. Useful for understanding what generates awareness, less useful for judging what actually closes deals.
- Multi-touch/data-driven spreads credit across the whole journey using GA4’s modeling. More accurate, but it needs volume and clean data to work reliably.
For implementation: turn on GA4’s enhanced measurement, connect Search Console for organic query data, push conversion events through GTM, and integrate your CRM so closed revenue links back to the original session. Constant Contact’s guide to tracking ROI recommends exactly this stack, GA4 plus a connected CRM, as the baseline setup most businesses need.
Pro Tip: If you’re a small B2B team without the traffic volume for reliable multi-touch modeling, use a hybrid: last non-direct click paired with CRM-confirmed closed revenue. It’s not perfect, but it’s honest, and Axon Garside’s B2B measurement approach backs this pipeline-first method for exactly this reason.
What Tools and Calculators Simplify ROI Tracking?
Your core stack should include GA4 and GTM for event tracking, a CRM such as HubSpot for closing the loop on revenue, and Search Console for organic visibility data.

For behavioral insight into why visitors convert or bounce, Hotjar or Microsoft Clarity show session recordings and heatmaps that turn a vague conversion problem into a specific fix. When you need to model numbers before committing budget, Smashing Magazine’s free ROI calculator spreadsheet is a genuinely useful template, and ytechnology’s calculator walks through the five levers, search visibility, conversion rate, closing rate, revenue per sale, and cost, that most influence payback speed.
How Do You Improve Website ROI Once You’re Measuring It?
Once tracking is running, prioritize fixes using a simple framework: rate each idea on Impact, Confidence, and Ease (ICE), then tackle the highest scores first. A checkout redesign might score high impact but low confidence; a clearer headline on your top landing page often scores high on all three.
- List candidate changes (headline clarity, CTA placement, page speed, form length).
- Score each on impact, confidence, ease.
- Run the highest-scoring change first, measure, then move to the next.
A practical CRO checklist to work through:
- Headline states the outcome, not the feature
- CTA button is visible without scrolling, on mobile especially
- Trust signals (reviews, credentials) sit near the decision point
- Page load speed is under three seconds on mobile
- Forms ask for the minimum fields needed to follow up
- Follow-up automation triggers within minutes of a lead, not days
Real examples of pages built around these principles are worth studying: see this breakdown of optimized service pages for what actually converts.
Pro Tip: Recalculate ROI after every change, not just annually. If you can’t isolate which specific change moved the number, you didn’t test one thing, you tested five and got a shrug.
How Often Should You Measure Website ROI?
Give a new site or redesign a 30 to 60 day stabilization window before trusting the data; tracking often has bugs in the first month that skew early numbers. After that, review monthly and step back for a deeper quarterly strategic review.
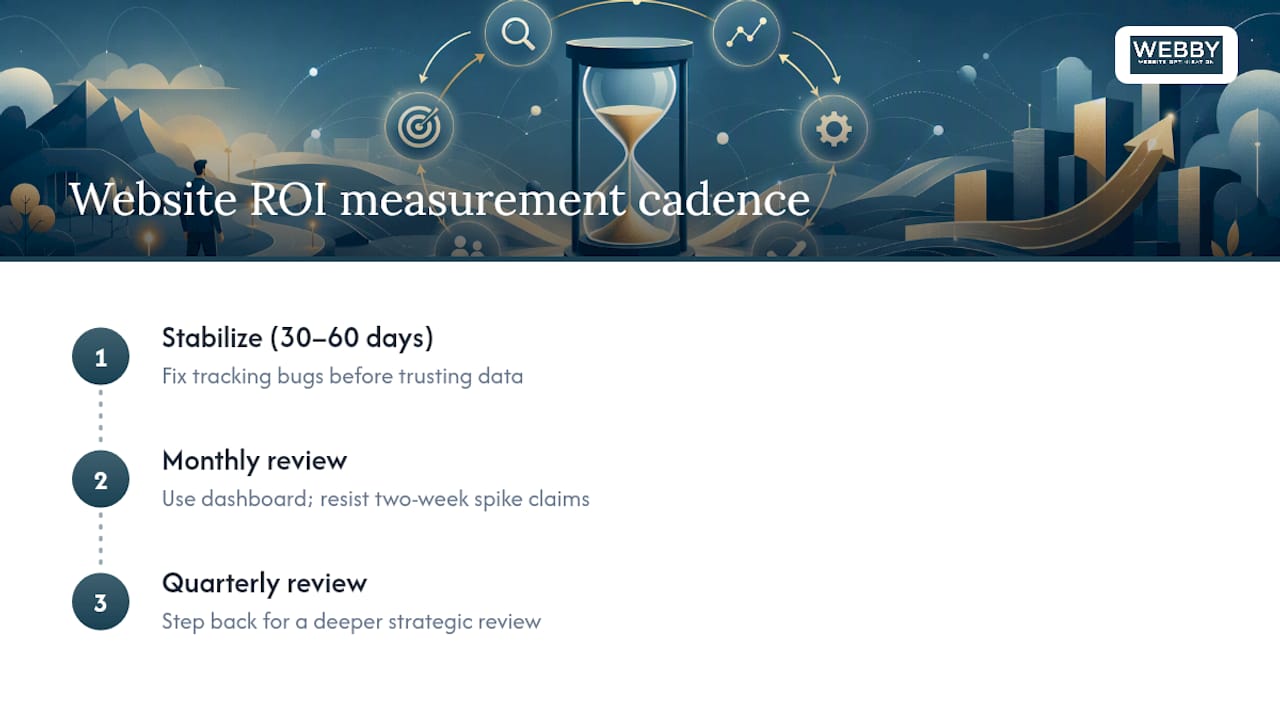
A useful monthly dashboard shows: attributed revenue, conversions by channel, revenue per visitor, cost per acquisition, cumulative ROI/payback progress, and results from any active experiments. Resist declaring a win on a two-week spike, small sample sizes swing wildly and mean less than they feel like they do.
What Does the Research Say About Realistic ROI Expectations?
Utsubo’s redesign research recommends capturing a 30 to 90 day pre-change baseline and modeling three scenarios, conservative, expected, and optimistic, before committing to a redesign budget. Payback period, in that model, equals total project cost divided by monthly incremental revenue.
A useful case-study skeleton for your own reporting:
- Baseline metrics before any change
- Specific interventions applied (and dates)
- Measurement window length
- Results: incremental revenue and calculated payback period
- Lessons learned, including what you’d do differently
This structure works whether you’re reporting to a boss, a partner, or just your own spreadsheet.
What Actually Moves the Needle for Local Service Businesses?
The pattern I see repeatedly with local service clients is almost boring in its consistency: capture a real baseline, run one prioritized CRO fix at a time, connect the CRM so closed revenue ties back to the lead source, and the payback math takes care of itself.
The one thing most owners skip in week one? Add a tracked phone number and a CRM lead source field. Without that, half your “direct” leads are actually website leads you’re not crediting.
Get Help Measuring and Improving Your Website’s Return
Setting up clean tracking, connecting a CRM, and running a prioritized CRO program takes time most business owners don’t have between running the actual business, so partnering with a digital marketing agency can streamline this process efficiently. Webby Website Optimisation builds that entire stack, GA4 and GTM configuration, revenue event mapping, CRM integration, and ongoing CRO testing, so the ROI number you report is one you actually trust.

If your current site was built years ago and every fix feels like patching a leak, a full rebuild often pays back faster than incremental tweaks. Our website design and development service is built around exactly this: tracking from day one, a conversion-focused structure, and a clear path to measuring payback within your first reporting cycle. If you need something live fast to start collecting data sooner, the website built in a day option shortens that runway considerably. Request a free audit and we’ll show you where your current site is leaking revenue before you spend another dollar guessing.
Sources
- How to Measure Website ROI: Step-by-Step Guide (2026) | Stackzeno
- Tracking your return on investment (ROI) — Constant Contact
Recommended
If this post raised some questions feel free to ask me a question