
So you’ve added Google Analytics to your WordPress blog, as per our February instructions. Now what? It’s time to get comfortable with the service—because Google Analytics can help you figure out what type of content you should produce more of, what your audience sees when they land on your site, and where all those readers are coming from. And that’s just for starters.
Yes, all your most worrisome website questions can be answered just by configuring the correct analytics. Some tasks may require a little set-up, but you already did the hard part by linking Google Analytics to your blog. Here’s a deep dive into how you can answer five of your most burning questions about blogging by harnessing the power of Google Analytics.
Am I meeting my goals?
Starting a website is only the first step—once it’s set up, you surely have specific goals you’d like to meet. Maybe your goal is to author a killer sales page that inspires purchases. Or to confirm that people are viewing your list of services, and that it’s not getting lost in the shuffle.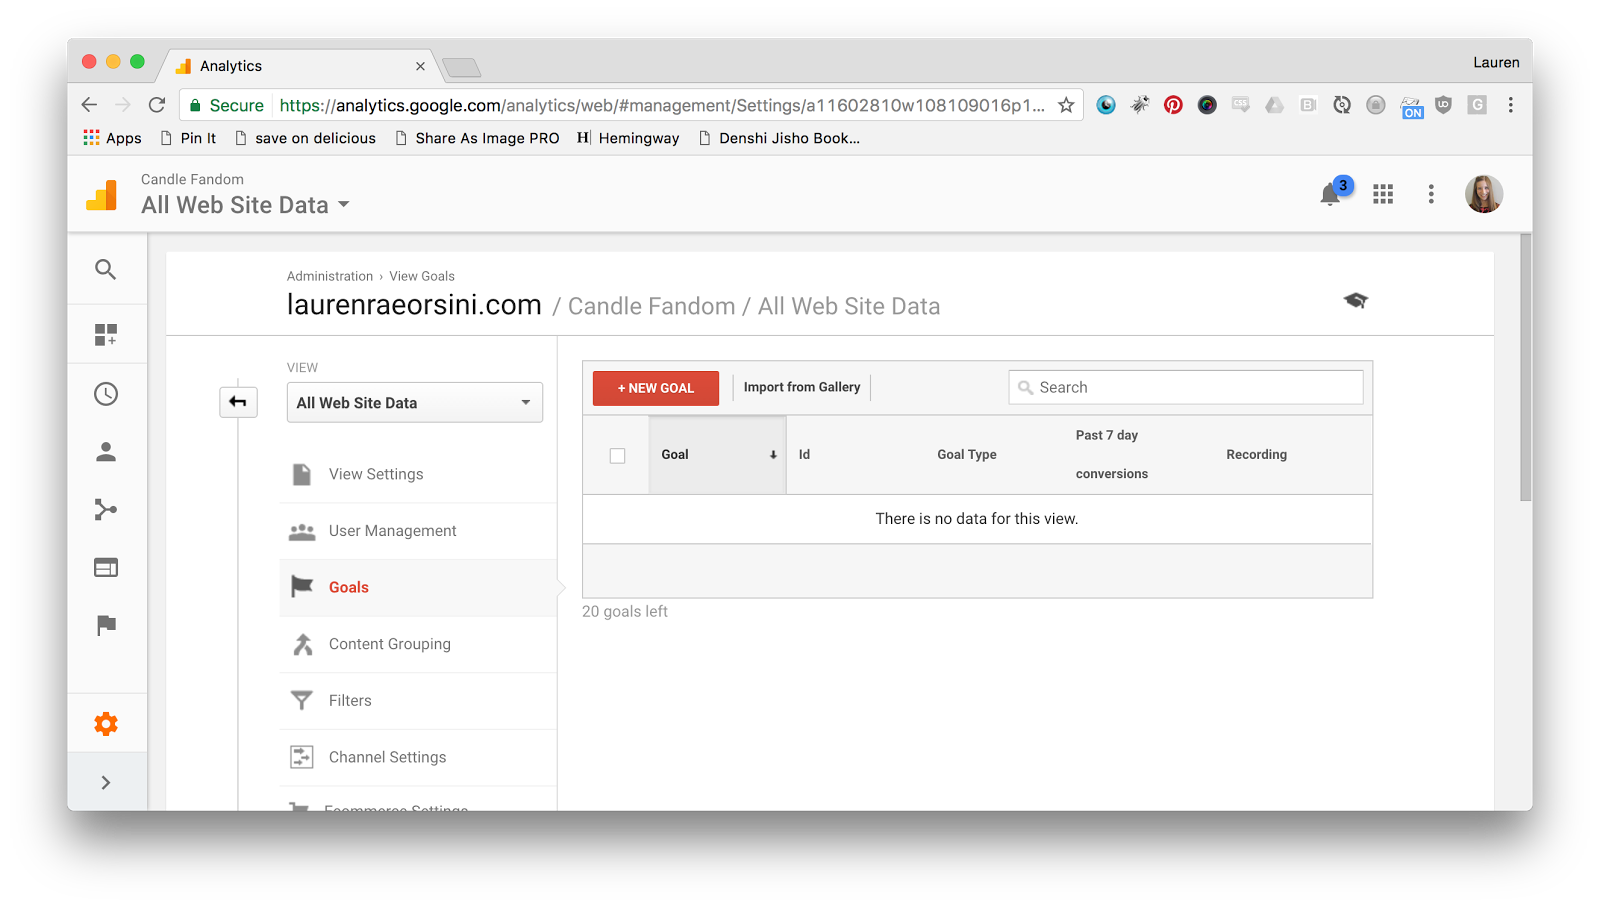
With Google Analytics, you can set custom objectives and monitor them with Goals. Navigate to Conversions → Goals to get started. The first thing you’ll need to do is enable the Goals view. After that, click the big red “New Goal” button to set up a user behavior to track.
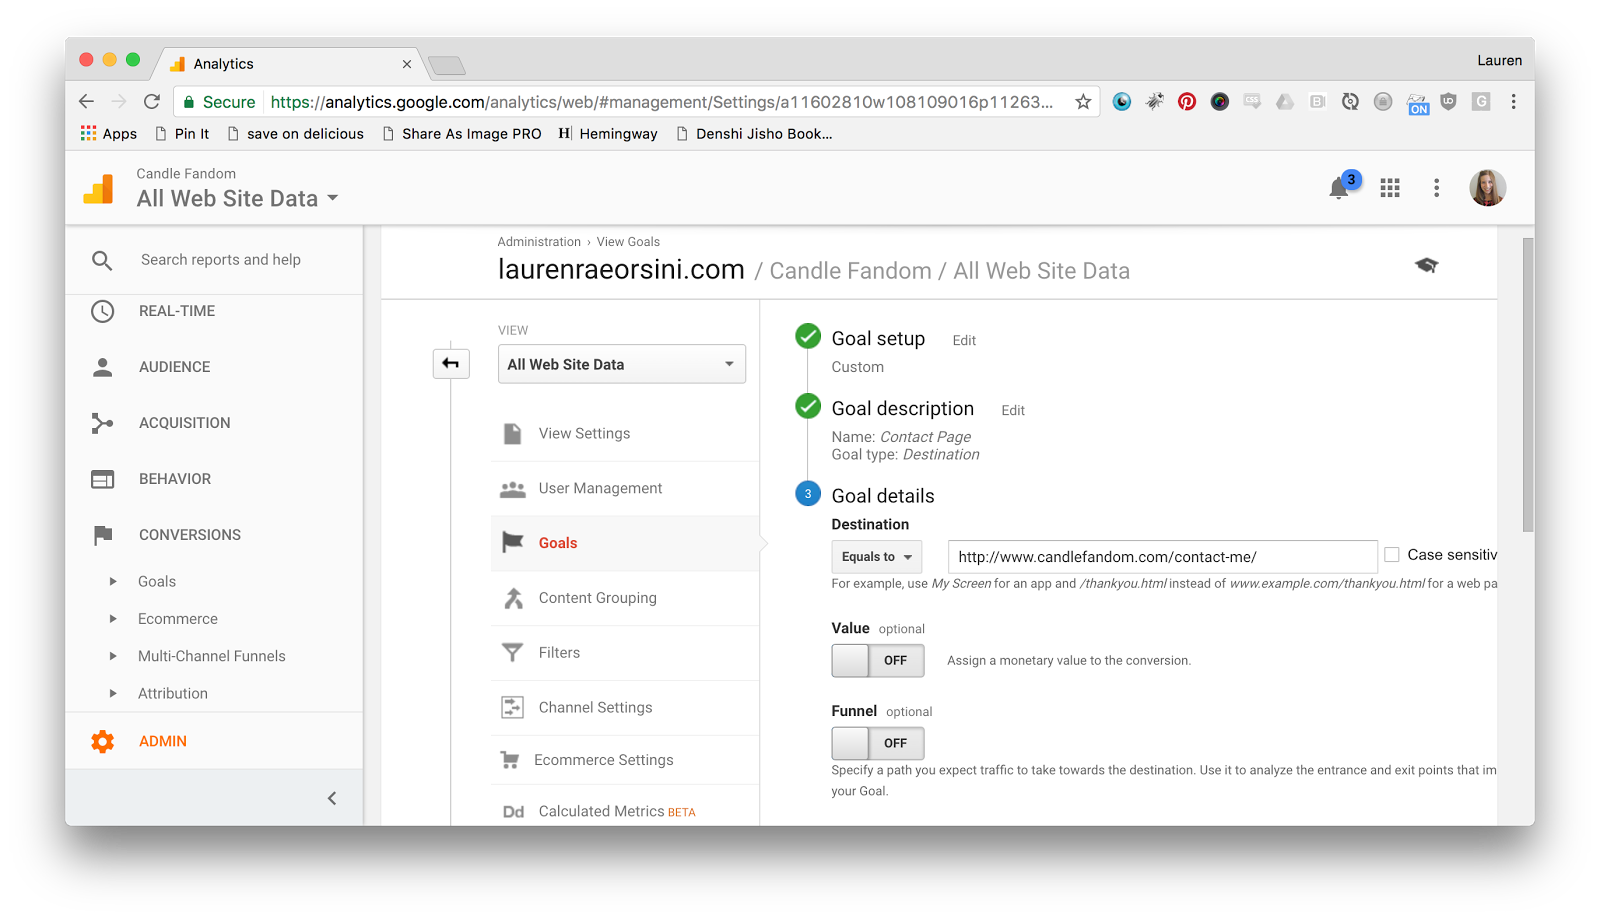 In this case, I want to see if people who visit my site are also visiting my Contact page. This is a review blog, and I want to make sure people know where to reach me if they want to send me products to review. I named this goal “Contact Page,” and set it as a “Destination” goal. Now, Google Analytics will track how often people visit this page while they’re spending time on my blog. If it’s too little, I might want to highlight the link more prominently.
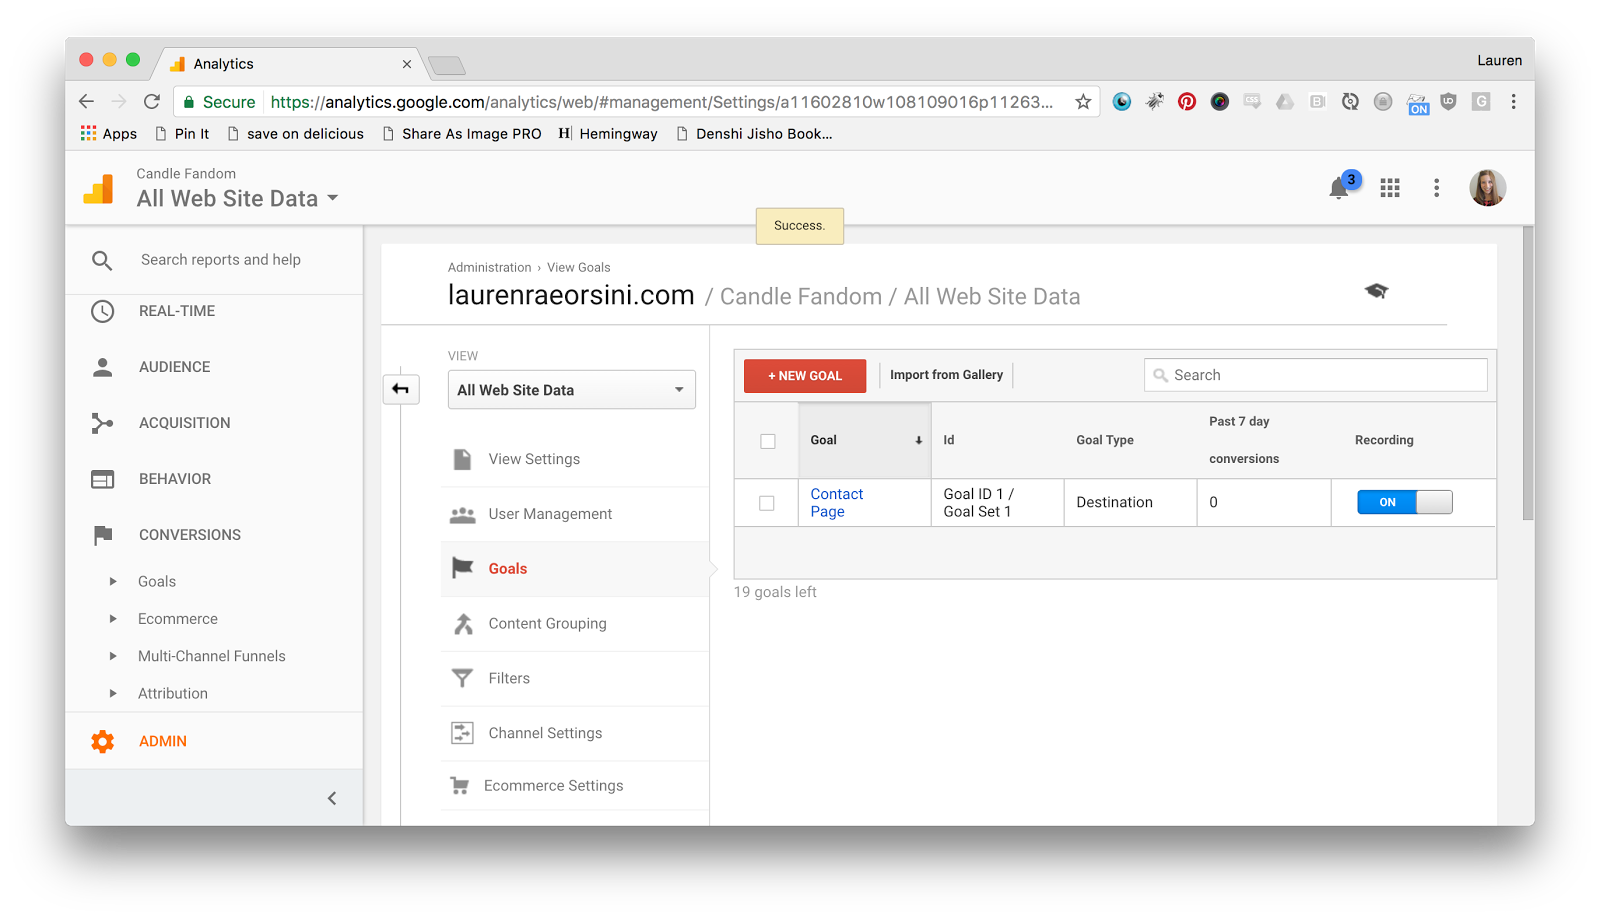 Your Goals page is a custom dashboard for checking your top objectives at a glance. It’s a shortcut to slogging through the considerable information that Analytics offers you out of the box, and a much more personal way to see if your site is accomplishing what you want it to accomplish.
Where is my audience (physically)?
As an American blogger, I was surprised to learn that one of my blogs has a considerable audience in the Philippines. Since 16 percent of my audience comes from the other side of the world, it has absolutely affected how I run my blog. I avoid posting U.S.-only resources. And when I promote an item I want to sell, I make sure to note that it is available internationally.
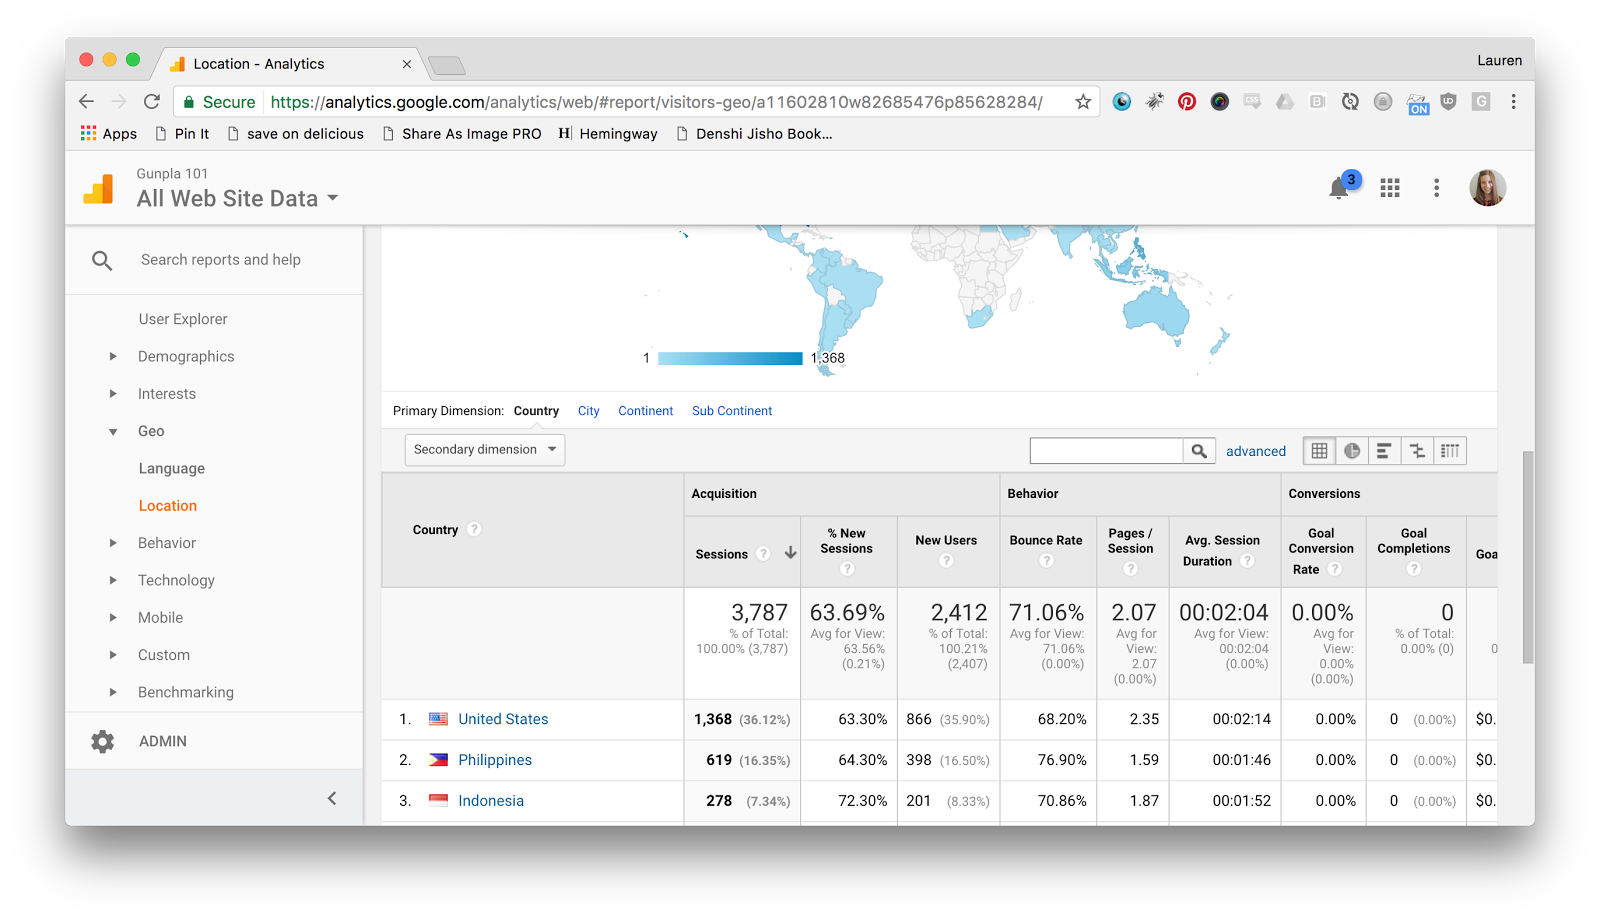
I would have never guessed I had an international audience without Google Analytics, which shows me this evidence undeniably. And now, because I have that knowledge, I am able to create international conversions when previously, I wouldn’t even have tried.

Find out if you have a hidden international audience by navigating to Audience → Location in the dashboard. Don’t forget that the map you see here is interactive, and you can pinpoint your audience not only by country, but by state and even city. Here, I’ve zoomed in to see that I have a lot of readers in California, so I should consider them while creating new content.
Geographic location is especially helpful if you are considering advertising your website on Google, Facebook, or another service. Most ad campaigns are aimed at a specific region, and if you know where your most engaged readers already are, you’ll know where to target.
Where is my audience (digitally)?
Where your audience lives is one thing, but you’ll also want to discover where viewers spend the bulk of their time online. As I am attempting to discover with the Goals feature, where you want your audience to click and where they actually do click doesn’t always measure up.
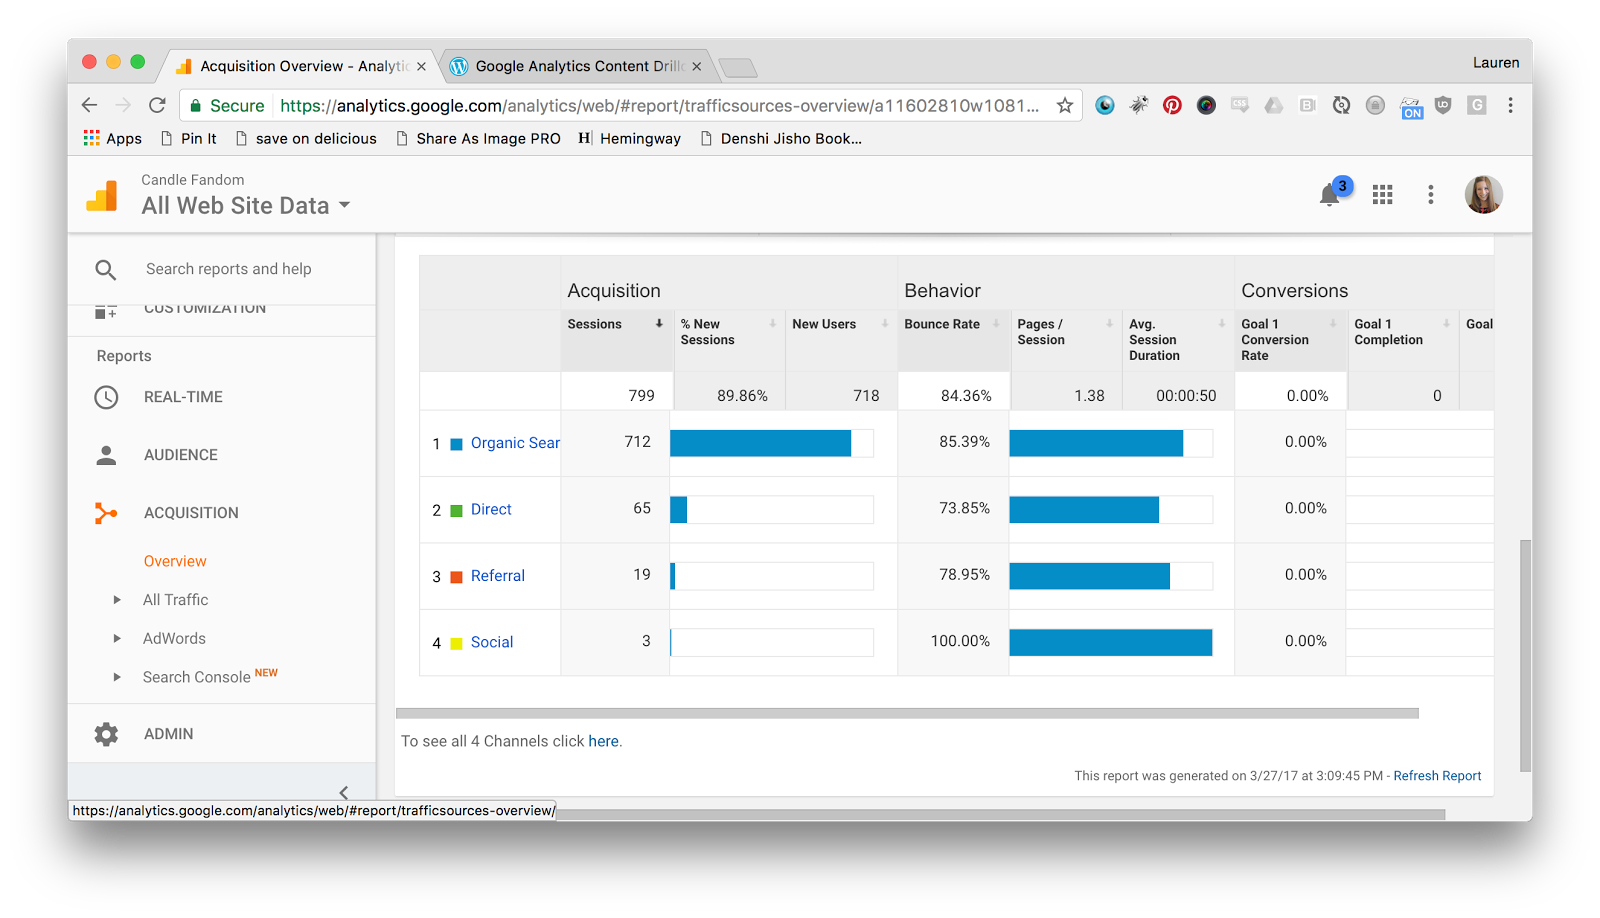 To get some clues about how your audience found you, check out the Acquisition tab. It’ll show you four different ways to track where your audience came from:
- Organic Search: The user typed something into a search engine, and landed on your site. This is less helpful than it used to be now that Google protects people’s queries by default, so most of the phrases will show up as “(not provided).”
- Direct: These are your most involved users—they typed your dot com into a URL bar directly in order to access your blog.
- Referral: The user saw a link to your site and clicked on it. If you see a spike in traffic, this section shows you which other site the majority of clicks came from.
- Social: The user saw a link to your site on social media and clicked it. This can help you choose which social media accounts are more valuable for your niche.
By determining where your audience was right before they ended up on your site, you can narrow down where on the web they spend their time. This can tell you a lot about where to best promote your site in order to gain more interested audience members.
What is my best (and worst) work?
One of the most powerful features of Google Analytics is the ability to see a drill-down of all your most popular work. This feature only gets better with age—the longer you have Google Analytics installed, the further back you can set the date range to check it out.  By default, Google Analytics will show you stats for the previous week. Adjust the date range in the upper right-hand corner to see more or less.
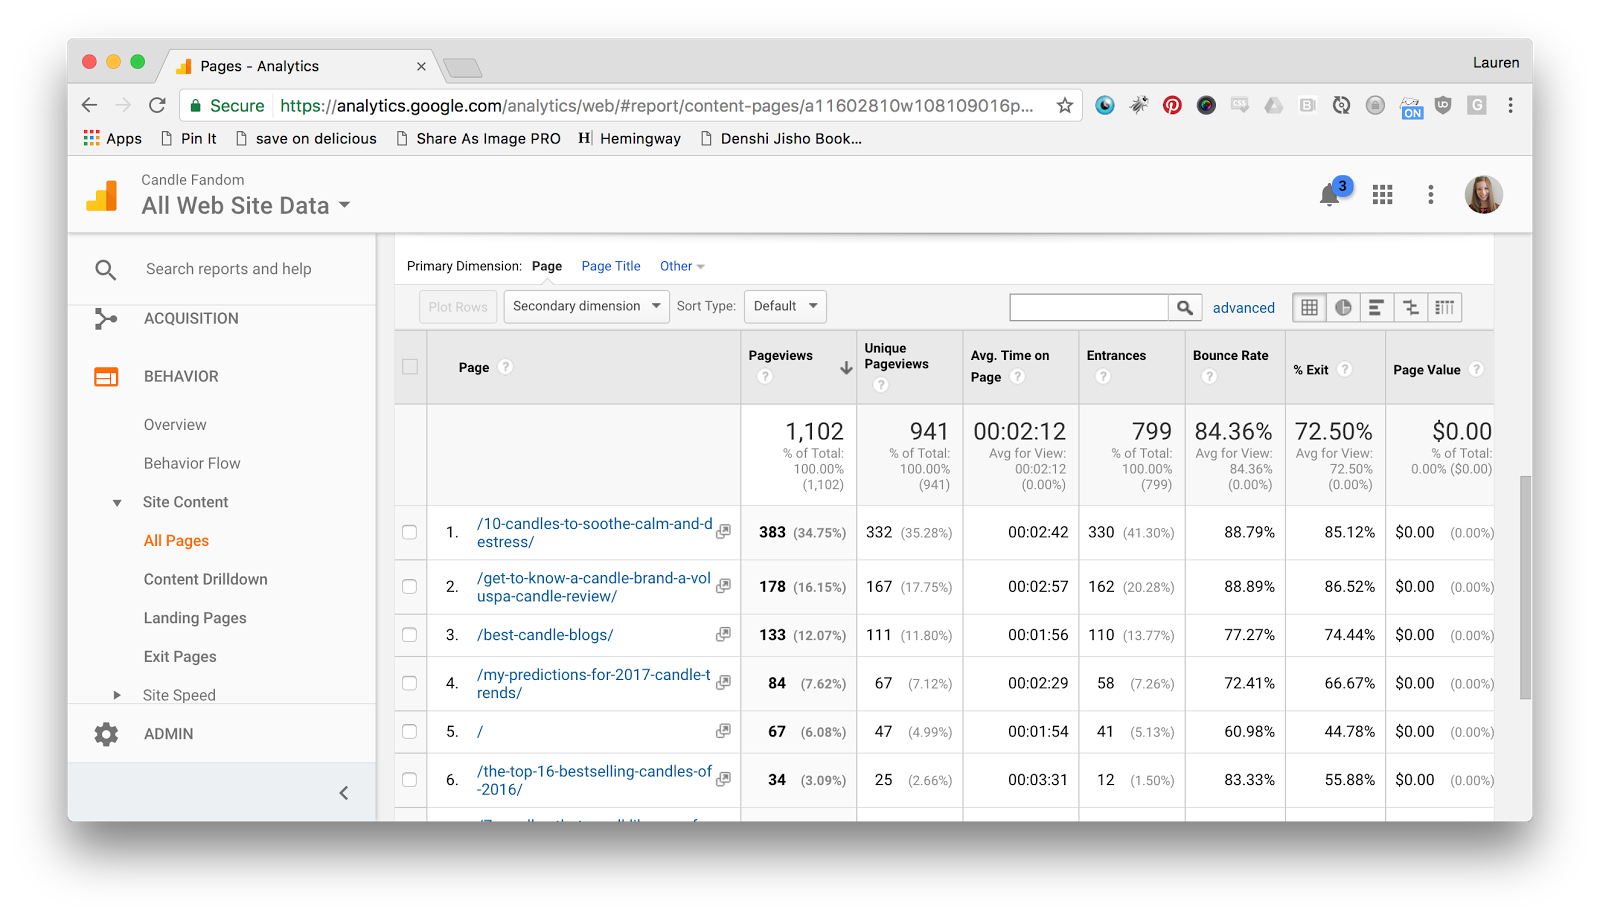
Once you’ve set the time frame you want to look at, navigate to Behavior → Site Content → All Pages. Here, you can see your most highly viewed posts and pages for that time. Click the column headings to sort this data; you can search by lowest bounce rate, most unique views, or even least unique views to see what’s not working.
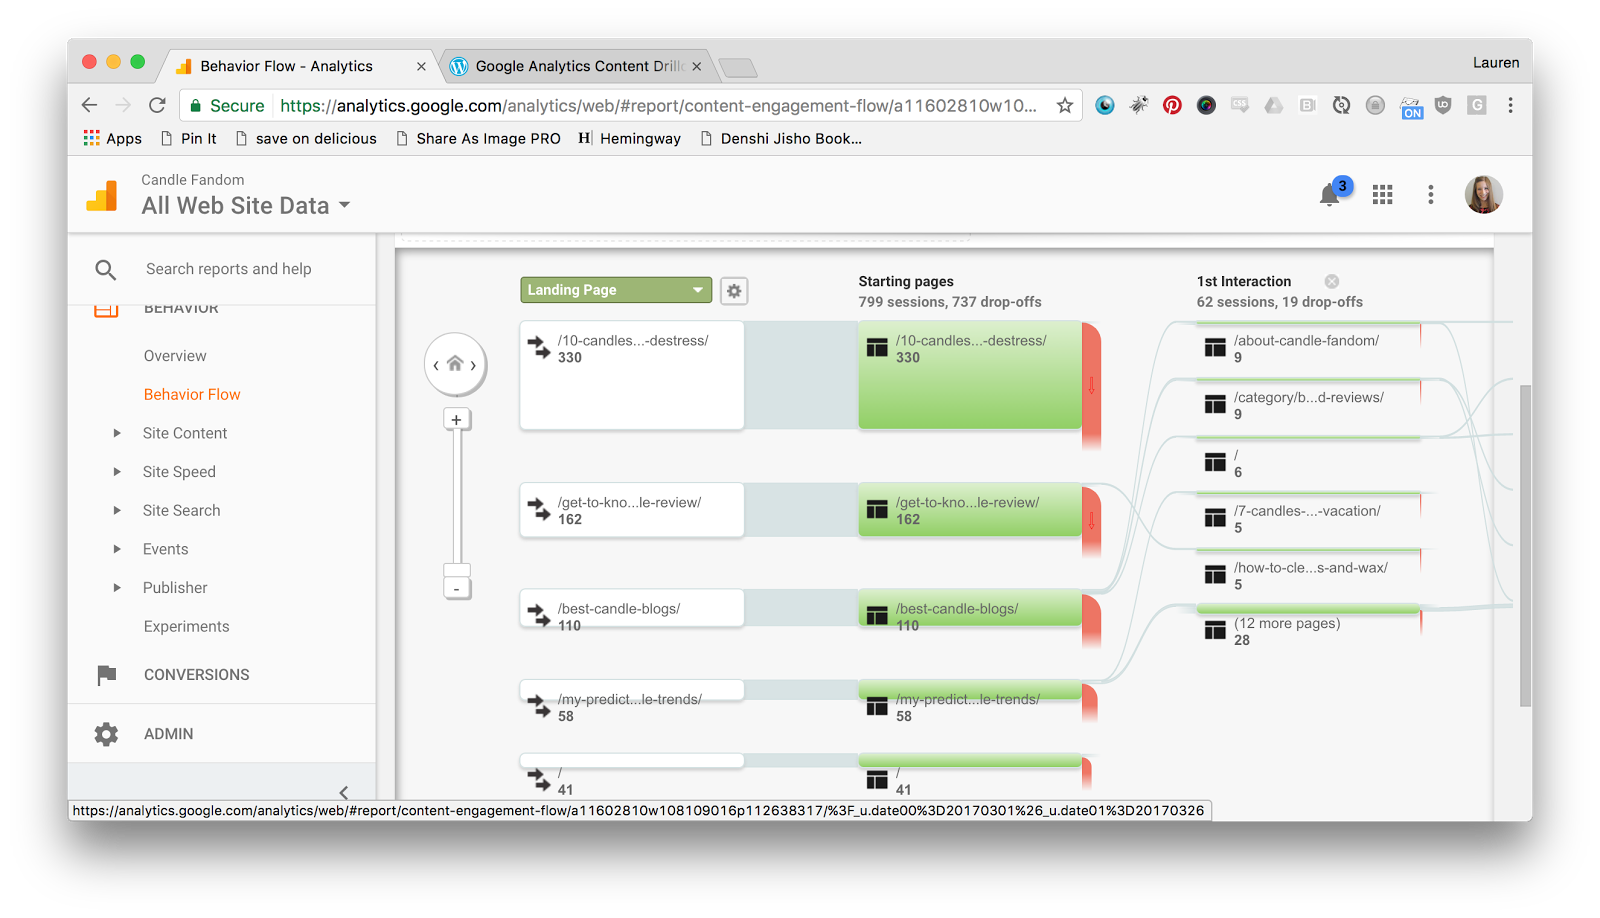
While you’re in the Site Content area, you may also want to check out Behavior Flow. This view shows you a visual of where people enter your site, and how long they stay there before leaving. You’ll see which pages are most often landing pages, and where people click following that. It can show you what to feature (and create more of), and what to revamp and improve.
Does my site look OK to visitors?
People come to your site from all different regions, referral sites—and browsers, too. Google Analytics can show you exactly which setups people are using to view your site. Navigate to Audience → Overview in order to see which browser, operating system, and even service provider people use most often to check your site. If a lot of people are visiting using Firefox, for example, it’d be a great idea to check that your site looks good to you in Firefox, even if that’s not a browser you normally use.
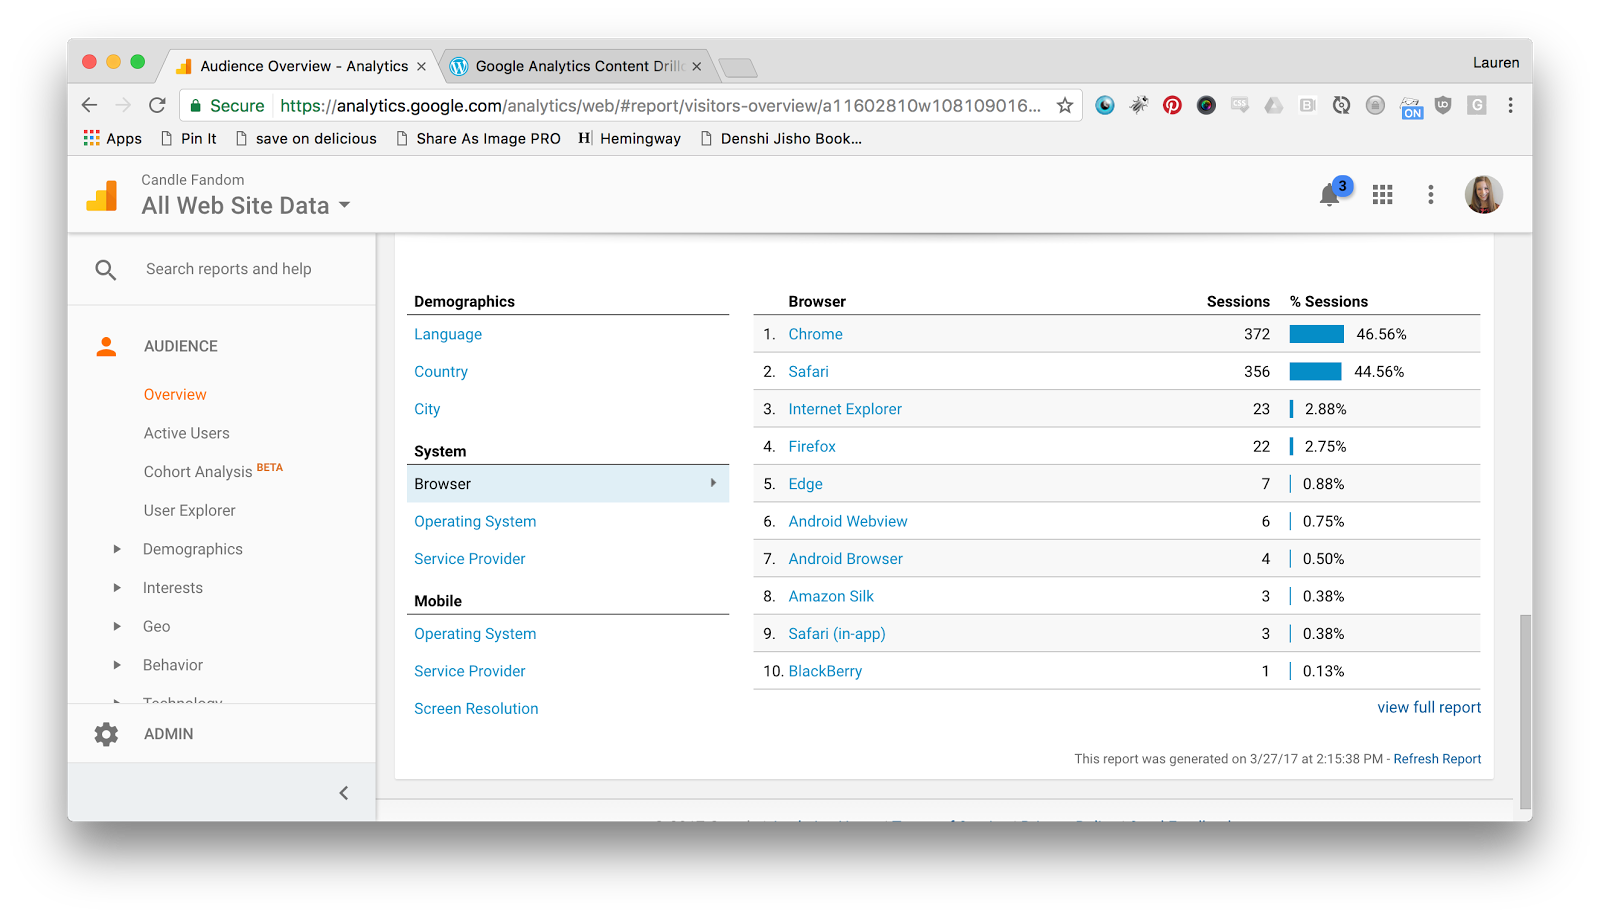 There’s also a section for mobile visitors only. Here, I can see that 67 percent of my mobile audience is on iOS, which implies that they are looking at the site via an iPhone. That means I should definitely make sure that I have an iPhone version of my site, or a responsive theme that can automatically resize itself to a small mobile screen.
 This information can keep you from neglecting to make your site look good on a browser a lot of people are using—or wasting your time trying to make your site compliant with a browser that your audience doesn’t use. You can rest assured that when users bring up your site, they’re seeing the very same design and content that you spent so much time perfecting.
These are five questions that Google Analytics can answer for you, but they’re still just scratching the surface. Addicted to that Google Analytics life now? Visit the Google Analytics Help Center to see everything this tool can help you do.
If this post raised some questions feel free to ask me a question