

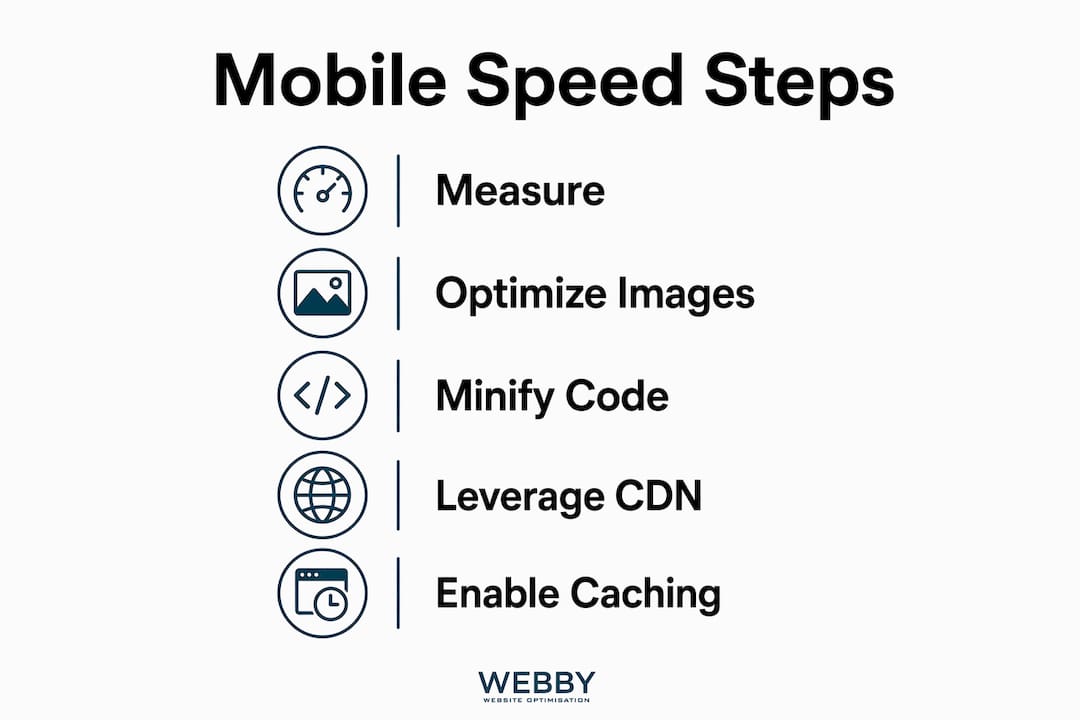
Mobile website speed optimization is the practice of reducing page load times on smartphones and tablets through targeted changes to images, code, server configuration, and content delivery. Mobile visitors abandon 53% of sessions when pages take over 3 seconds to load, and a single second of improvement can lift conversion rates by 17%. That data point alone reframes speed as a revenue issue, not a technical one. To improve mobile website load speed effectively, you need to understand Google’s Core Web Vitals, use tools like Google PageSpeed Insights, GTmetrix, and Chrome DevTools, and address the specific constraints of mobile hardware and networks. This guide covers every layer of the problem.
What are the key metrics and tools for measuring mobile load speed?
Google’s Core Web Vitals define the performance targets every mobile site should hit. The ‘Good’ thresholds are Largest Contentful Paint (LCP) at or below 2.5 seconds, Interaction to Next Paint (INP) at or below 200 milliseconds, and Cumulative Layout Shift (CLS) at or below 0.1, all measured at the 75th percentile of real user data. These numbers are not aspirational targets. They are the thresholds Google uses when evaluating page experience for search ranking.
Understanding the difference between lab data and field data is critical here. Lab data comes from tools like Lighthouse or GTmetrix running a simulated page load under controlled conditions. Field data, also called real user monitoring (RUM), reflects actual visits from real devices on real networks. Optimizing for field data rather than just lab scores is what translates into genuine ranking improvements and better user experience.
Here is how to set up a reliable measurement workflow:
- Google PageSpeed Insights: Combines Lighthouse lab data with Chrome User Experience Report (CrUX) field data. Run it on your most important pages, not just the homepage.
- GTmetrix: Provides waterfall charts that show exactly which resources are blocking load. Use the “Mobile” test profile to simulate a mid-range Android device.
- Chrome DevTools: Use the Performance tab with CPU throttling set to 4x slowdown and network throttling set to “Fast 4G” to simulate real mobile conditions.
- WebPageTest: Allows testing from specific geographic locations and on real mobile devices, which exposes latency issues that desktop testing completely misses.
Pro Tip: Test from multiple locations and devices before making any changes. A site that scores 90 in Sydney may score 60 in Perth or regional areas due to server location and CDN coverage gaps.
How can image optimization improve your mobile website load speed?
Images are the single largest contributor to page weight on most websites, and they are also the fastest win available. The average mobile page carries far more image data than a mobile connection can handle efficiently, which directly tanks LCP scores. Fixing images requires a specific sequence of decisions, not just compression.
- Prioritize the LCP image above everything else. Do not lazy-load your hero image. Add "fetchpriority="high"
and a` tag in the document head. This tells the browser to fetch it immediately rather than waiting for the full HTML to parse. - Switch to WebP or AVIF formats. WebP delivers roughly 25 to 35 percent smaller file sizes than JPEG at equivalent visual quality. AVIF goes further, often achieving 50 percent reductions. Both formats are supported by all modern mobile browsers.
- Use
srcsetandsizesattributes. Serving a 1400px wide image to a 390px wide phone screen wastes bandwidth and slows load time. Withsrcset, you define multiple image sizes and let the browser pick the right one for the device. - Set explicit
widthandheightattributes on every image. Explicit image dimensions allow the browser to reserve the correct layout space before the image loads, which prevents the jarring layout shifts that hurt CLS scores on narrow mobile viewports. - Lazy-load below-the-fold images. Add
loading="lazy"to any image the user cannot see on first load. This defers their download until the user scrolls toward them, reducing initial page weight significantly.
Pro Tip: Tools like Cloudinary, Imgix, and ShortPixel automate format conversion, resizing, and compression. For WordPress sites, plugins like Imagify or EWWW Image Optimizer handle this at the server level without manual intervention.
What JavaScript and CSS optimizations specifically enhance mobile load speed?

Mobile CPUs process JavaScript far slower than desktop processors. Blocking JavaScript and oversized JS bundles directly worsen INP scores because they tie up the main thread, preventing the browser from responding to user interactions. This is the most technically complex area of mobile speed work, but the gains are substantial.
The core principle is simple: only load what the page needs to render above the fold, and defer everything else.
- Defer or async non-critical scripts. Add
deferto scripts that do not need to run before the page renders. Useasyncfor scripts that are independent of each other. Both attributes prevent scripts from blocking HTML parsing. - Code-split your JavaScript bundles. Frameworks like React, Vue, and Next.js support dynamic imports, which split large JS files into smaller chunks loaded on demand. This reduces the initial bundle size the mobile browser must download and parse.
- Minify CSS and JavaScript. Tools like Terser for JavaScript and cssnano for CSS remove whitespace, comments, and redundant code. Most build tools like Webpack and Vite handle this automatically in production mode.
- Inline critical CSS. Extract the CSS needed to render above-the-fold content and place it directly in the
<head>. This eliminates a render-blocking stylesheet request for the most visible part of your page. - Manage third-party scripts aggressively. Third-party scripts from analytics platforms, chat widgets, and ad networks frequently cause heavy main-thread blocking on mobile. Audit every third-party tag and defer or remove those that do not directly support conversions.
- Handle web fonts correctly. Using
font-display: swapand preloading critical font files reduces text rendering delays and prevents the layout shifts that hurt CLS on mobile.
Pro Tip: Use Chrome DevTools’ Performance panel to identify “Long Tasks,” which are JavaScript executions over 50 milliseconds. Breaking these up with scheduler.yield() or setTimeout chunks directly improves INP on mobile devices.
How do caching, CDN usage, and server infrastructure influence mobile page load speed?
No amount of frontend optimization compensates for a slow server. Time to First Byte (TTFB) measures how long the browser waits before receiving the first byte of HTML from the server. On mobile networks with higher latency than wired connections, a slow TTFB compounds every subsequent load delay.
Healthy TTFB near CDN edge servers sits between 100 and 300 milliseconds. Anything above 600ms signals a server-side problem that frontend work cannot fix.
| Infrastructure layer | What it does | Mobile impact |
|---|---|---|
| Page caching | Serves pre-built HTML instead of generating it per request | Cuts TTFB from 800ms+ to under 200ms for cached pages |
| Object caching (Redis/Memcached) | Stores database query results in memory | Reduces server processing time for dynamic pages |
| CDN (Cloudflare, Fastly, AWS CloudFront) | Serves static assets from edge nodes near the user | Reduces asset download latency by 40 to 70 percent depending on geography |
| HTTP/2 or HTTP/3 | Multiplexes multiple requests over a single connection | Eliminates head-of-line blocking, critical on high-latency mobile connections |
For WordPress sites specifically, plugins like WP Rocket or W3 Total Cache handle page caching and object caching configuration without requiring server access. Cloudflare’s free tier provides CDN coverage across 300 global edge locations, which directly benefits mobile users in regional areas of Australia who are geographically distant from origin servers.
Testing from multiple geographic locations reveals CDN gaps and server location mismatches that single-location testing never exposes. A Perth-based business serving clients in regional Western Australia should verify performance from those locations specifically, not just from capital city nodes.
What common mistakes should you avoid when improving mobile site speed?
Most mobile speed problems come from a short list of repeatable errors. Fixing these alone can move a site from a failing Core Web Vitals score to a passing one.
- Lazy-loading the hero image. This is the most common LCP killer. The browser delays fetching the most important visual on the page, which pushes LCP past 4 seconds on mid-range devices.
- Serving desktop-sized images to mobile. A 2400px wide banner image sent to a 390px screen wastes bandwidth and slows load time with zero visual benefit.
- Relying only on lab scores. A PageSpeed Insights score of 90 in a lab test can coexist with failing field data if real users are on slower devices or networks. Field data reflects actual user experience and is what Google uses for ranking signals.
- Skipping image dimension attributes. Without explicit width and height, the browser cannot reserve space for images during load, which causes visible layout jumps and CLS failures.
- Ignoring TTFB. Developers often spend hours optimizing frontend assets while the server takes 1.5 seconds just to respond. Fix the server first.
- Not testing on real devices. Testing on actual mobile devices under 4G conditions exposes performance issues that emulators and desktop Chrome DevTools throttling do not fully replicate.
“Mobile hardware limitations such as slower CPUs and network latency amplify the impact of frontend inefficiencies. Trimming page weight and blocking scripts is not optional on mobile. It is the baseline.” — Omni Apps
If your site shows a website redesign is overdue, speed problems are often a symptom of deeper structural issues that incremental fixes cannot fully resolve.
Key takeaways
Faster mobile load times require fixing server response, images, JavaScript, and caching together. No single change delivers the full improvement on its own.
| Point | Details |
|---|---|
| Core Web Vitals targets | Hit LCP ≤ 2.5s, INP ≤ 200ms, and CLS ≤ 0.1 at the 75th percentile of real user data. |
| Prioritize the LCP image | Preload the hero image with fetchpriority="high" and never apply lazy-loading to it. |
| Manage JavaScript on mobile | Defer non-critical scripts, split code bundles, and audit third-party tags to protect INP. |
| Fix server and CDN first | Achieve TTFB under 300ms using page caching and a CDN before optimizing frontend assets. |
| Measure field data, not just lab scores | Use Google PageSpeed Insights CrUX data and real device testing to validate improvements. |
Why mobile speed is the one thing I would never deprioritize
After working on dozens of websites for local service businesses across Perth and Fremantle, the pattern I see most often is this: a business owner invests in SEO, gets rankings moving, and then watches conversions stay flat. Nine times out of ten, the culprit is a mobile site that takes five or six seconds to load on a mid-range Android phone.
The uncomfortable truth is that most small business websites are built and tested on fast desktop computers with wired internet connections. Nobody checks what the site feels like on a Samsung Galaxy A-series phone on a 4G connection in Fremantle. That is the device and network your actual customers are using.
Google’s mobile-first indexing means the mobile version of your site is what gets crawled and ranked. A slow mobile experience does not just hurt conversions. It directly suppresses your search visibility. I have seen sites gain two to four ranking positions within six weeks of addressing Core Web Vitals alone, without any new content or link building.
The other thing I would push back on is the idea that speed optimization is a one-time project. Setting performance budgets and tracking Core Web Vitals in real user monitoring tools is what separates sites that stay fast from sites that regress after every plugin update or new marketing script gets added. Speed is a system, not a task.
If you are doing a DIY SEO audit and mobile speed is not on your checklist, you are auditing the wrong things.
— Steve Doig
How Webby Website Optimisation can speed up your mobile site

Webby Website Optimisation works with local service businesses in Perth, Fremantle, and Melville to diagnose and fix exactly the mobile speed issues covered in this guide. The team runs full performance audits using Google PageSpeed Insights and real device testing, then implements image optimization, caching configuration, CDN integration, and JavaScript cleanup as a coordinated package. This is not a generic checklist. It is a targeted fix based on what your specific site actually needs. If your mobile scores are failing or your conversions are not matching your traffic, get a free performance audit from Webby and find out what is holding your site back.
FAQ
What is a good mobile page load time in 2026?
Google’s Core Web Vitals set LCP at or below 2.5 seconds as the “Good” threshold for mobile. Pages loading in under 2 seconds generally see the strongest engagement and conversion rates.
How do I test my mobile website speed?
Use Google PageSpeed Insights for combined lab and field data, GTmetrix with a mobile test profile for waterfall analysis, and Chrome DevTools with CPU and network throttling to simulate real mobile conditions.
Does mobile site speed affect Google rankings?
Yes. Google uses Core Web Vitals as a ranking signal through its page experience update, and mobile-first indexing means the mobile version of your site is the primary version evaluated for search rankings.
What is the fastest way to reduce mobile load time?
Preloading the LCP image, switching to WebP or AVIF image formats, deferring non-critical JavaScript, and enabling page caching typically produce the largest load time reductions with the least implementation complexity.
Why does my site score well in PageSpeed but still feel slow?
Lab scores measure a single simulated load under ideal conditions. Real users on slower devices or networks experience higher load times. Check the field data section of Google PageSpeed Insights, which reflects actual Chrome user visits to your site.
Recommended
- SME Website Design Best Practices That Convert
- 9 Signs Your Website Needs a Redesign Now
- What Is On-Page Optimisation? Your 2026 SEO Guide
- Build an Affordable Business Website in 2026
If this post raised some questions feel free to ask me a question
Trackbacks/Pingbacks