
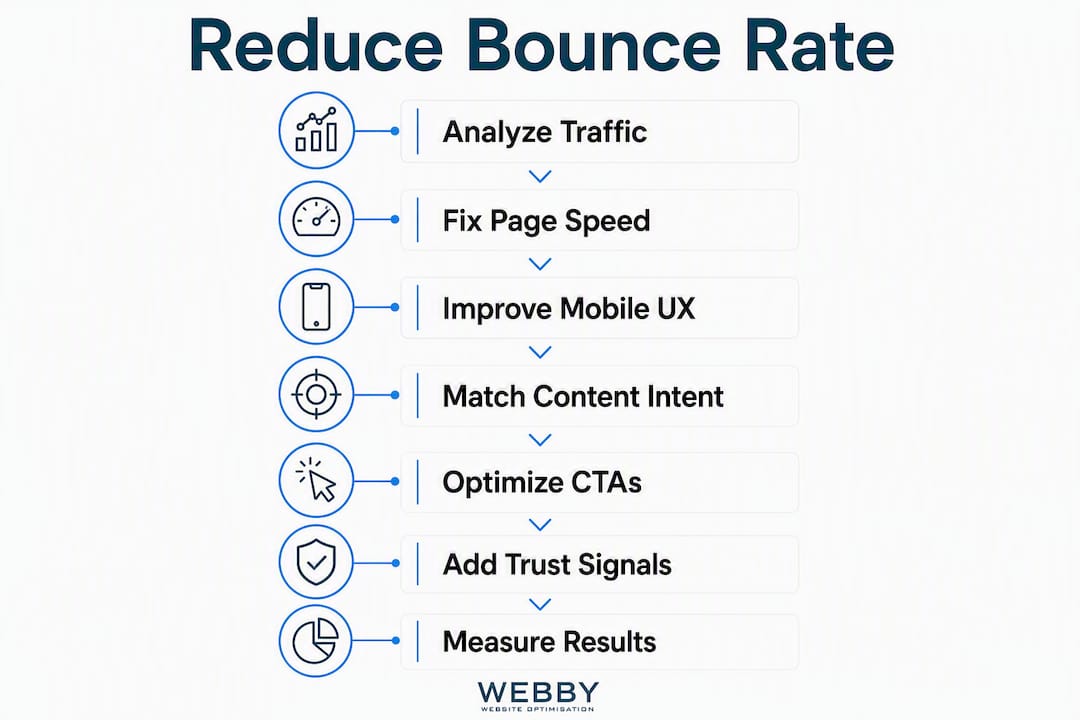
The fastest way to reduce your website’s bounce rate is to fix page speed, match your content to what visitors actually searched for, and give them a clear next step. Start here, in this order:
- Fix page speed first. Run Google PageSpeed Insights and target an LCP (Largest Contentful Paint) under 2.5 seconds. Compress images to WebP, enable caching, and defer non-critical JavaScript.
- Match content to search intent. Check the top five SERP results for your target keyword. If your page format doesn’t match what Google is ranking, rewrite the headline and opening paragraph to answer the query in the first two sentences.
- Clarify what’s above the fold. Visitors should know within three seconds what the page is about and what to do next. A vague headline or a hero image with no text kills this.
- Fix mobile UX. Set base font to 16px, make tap targets at least 44×44px, and eliminate horizontal scroll. More than half of web traffic arrives on mobile devices.
- Add a clear CTA and contextual internal links. One primary call-to-action per page, repeated at mid-page and bottom. Place contextual internal links inside paragraphs, not just the footer.
- Remove intrusive elements and fix technical errors. Kill entry popups, repair 404s, fix broken images, and resolve any SSL/mixed-content warnings.
Diagnostic tools to run right now: Google Analytics 4 (GA4), Google PageSpeed Insights / Lighthouse, WebPageTest, Hotjar (heatmaps and session recordings), GTmetrix.
Pro Tip: Don’t try to fix everything at once. Pick the one page with the highest traffic and worst engagement rate in GA4, apply the speed and intent fixes there first, and measure for two weeks before moving on.

Table of Contents
- Why does bounce rate matter for your website?
- How to diagnose the real cause before you start fixing
- Step 1: How do you fix page speed to reduce bounces?
- Step 2: What mobile UX fixes reduce bounce rate the most?
- Step 3: How do you match content to search intent?
- Step 4: Where should you place CTAs and internal links?
- Step 5: What technical fixes and trust signals reduce immediate exits?
- Step 6: How do you measure improvements and know they’re working?
- What does the research say about speed and content clarity?
- Timeboxed implementation checklist
- Key Takeaways
- The bounce rate fix most businesses skip
- Webby Website Optimisation can audit and fix your bounce rate
- Useful tools for diagnosing and fixing bounce rate
Why does bounce rate matter for your website?
Bounce rate measures the percentage of sessions where a visitor lands on a page and leaves without taking any further action. In Universal Analytics, that meant leaving without visiting a second page. GA4 changed the definition: it now tracks engagement rate (sessions lasting more than 10 seconds, triggering a conversion, or viewing a second page), and bounce rate is simply the inverse. A 70% bounce rate in GA4 means 30% of sessions were “engaged.”

That distinction matters in practice. A page with a 75% bounce rate isn’t automatically broken.
When a bounce is fine
Some single-page visits are successful outcomes. A visitor who Googles your phone number, finds it on your contact page, and calls you has bounced in GA4’s terms but converted in yours. Mailchimp’s resources on bounce rate make this point clearly: the goal isn’t a 0% bounce rate, it’s meaningful engagement where a second click or conversion is expected.
Pages where a high bounce rate is acceptable:
- Contact and “find us” pages (visitor got what they needed)
- Blog posts answering a single factual question
- News or announcement pages
Pages where a high bounce rate signals a real problem:
- Service and product pages (visitors should convert or explore)
- Landing pages tied to paid campaigns
- Homepage (should funnel visitors deeper into the site)
Practical benchmark ranges
Typical bounce rates vary by page type; for example, homepage bounce rates tend to be lower than blog posts, and landing pages tied to paid campaigns typically have relatively high bounce rates. Benchmark ranges depend greatly on context and should be interpreted accordingly.
Segment by page type before benchmarking. A 75% bounce rate on a blog post is normal; on a service page, it’s a signal worth investigating.
Stat: Google’s research, as reported by Verlua, shows that moving from a 1-second load time to 3 seconds increases bounce probability by roughly 32%. At 5 seconds, that probability rises by around 90%. Sites loading in 1 second can see bounce rates near 7%; at 5 seconds, that figure climbs to around 38%.
Pro Tip: In GA4, go to Reports → Engagement → Landing page to see engagement rate by page. Sort ascending to find your worst performers. Filter for pages with at least 100 sessions to cut out statistical noise.
How to diagnose the real cause before you start fixing
Chasing symptoms wastes time. A page with a 78% bounce rate could be slow, could be targeting the wrong audience, or could simply be getting traffic from a social campaign that was never meant to convert. The fix for each is completely different.
Step-by-step GA4 diagnostic
- Open GA4 → Reports → Engagement → Landing page.
- Sort by bounce rate (descending) and filter for pages with at least 100 sessions in the last 30 days.
- Note the top three to five worst-performing pages.
- For each page, apply a secondary dimension: Session source / medium. A page bouncing heavily from paid social but performing fine from organic search is a campaign problem, not a page problem.
- Apply a device-category secondary dimension. If mobile bounce rate is 20+ points higher than desktop, the issue is almost certainly mobile UX or load time on slower connections.
- Check country. International traffic landing on a page optimized for a local audience will always bounce at higher rates.
HubSpot’s bounce rate guide makes the point directly: high bounce rates are often a symptom of traffic misalignment, not a UX fault. Segment first.
When to bring in Hotjar
Once GA4 tells you which pages and which segments are bouncing, open Hotjar (or a comparable session-recording tool) and watch five to ten recordings for that specific page and traffic source. You’re looking for:
- Rage clicks (visitors clicking something that isn’t a link)
- Scroll depth (are they even reading past the fold?)
- Form abandonment
- Cursor hesitation near the CTA
Heatmaps confirm whether visitors are seeing your CTA at all. If the scroll map shows 80% of visitors never reach the mid-page CTA, moving it above the fold is a higher-priority fix than rewriting the copy.
Prioritization: match the cause to the fix
| Root cause | Signal in GA4/Hotjar | First action |
|---|---|---|
| Slow load time | High bounce across all sources | Run PageSpeed Insights, fix LCP |
| Intent mismatch | High bounce from organic, low time on page | Rewrite headline and opening paragraph |
| Traffic source mismatch | High bounce only from paid/social | Review campaign targeting and landing page alignment |
| Mobile UX | Mobile bounce >> desktop bounce | Fix tap targets, font size, remove interstitials |
| Technical error | Sudden bounce spike | Check for 404s, broken images, SSL issues |
Step 1: How do you fix page speed to reduce bounces?
Speed is the single highest-leverage fix for most sites. Research consistently shows that load time and bounce rate move together almost linearly. The good news: most small business WordPress sites have obvious, fixable performance problems that don’t require a developer.
The fixes that move the needle fastest
- Compress and convert images — Switch from JPEG/PNG to WebP or AVIF. An uncompressed hero image is often the single biggest LCP culprit. Tools like Squoosh or a WordPress plugin handle batch conversion.
Which tools to use and what to target
Run Google PageSpeed Insights / Lighthouse first: it gives you a prioritized list of fixes with estimated savings. Then run GTmetrix for a waterfall view showing which specific resources are slowest. Use WebPageTest for multi-location testing and to check performance on throttled mobile connections, which is where most small business sites fall apart.
Targets: LCP under 2.5 seconds, INP (Interaction to Next Paint) under 200ms, CLS (Cumulative Layout Shift) under 0.1.
Pro Tip: Fix TTFB before touching front-end assets. If your server takes 1.2 seconds to respond, no amount of image compression will get your LCP under 2.5 seconds. Check TTFB in WebPageTest’s “Connection View” tab.
Step 2: What mobile UX fixes reduce bounce rate the most?
Mobile traffic accounts for more than half of global web sessions, and mobile visitors bounce at higher rates on nearly every site type. The fixes are mostly straightforward, but they require testing on a real device, not just Chrome DevTools emulation.
Mobile UX checklist:
- Base font size: 16px minimum. Anything smaller forces pinch-to-zoom, and visitors leave rather than zoom.
- Tap targets: 44×44px minimum. Buttons and links that are too small cause mis-taps and frustration. Google’s Lighthouse flags these automatically.
- No horizontal scroll. Set
max-width: 100%on images and containers. Horizontal scroll on mobile is almost always a CSS oversight. - Remove full-screen entry interstitials on mobile. Google penalizes these in mobile search rankings, and they cause immediate exits. Use exit-intent or scroll-triggered overlays instead.
- Responsive images. Use
srcsetto serve appropriately sized images to mobile screens rather than scaling down a 2,000px desktop image. - Test on a real device. DevTools emulation doesn’t replicate real network conditions or touch behavior accurately. Test on at least one mid-range Android device and one iPhone.
For local service businesses, the benefits of professional web design extend directly to mobile: a layout built for mobile-first visitors keeps them on the page long enough to call or submit a form.
Step 3: How do you match content to search intent?
A page can load in under a second and still bounce at 85% if it doesn’t deliver what the visitor came for. Intent mismatch is the most common cause of high bounce rates on service pages, and it’s often invisible until you look at the SERP.
Audit your intent in four steps
- Google your target keyword in an incognito window and look at the top five results. Are they guides, lists, product pages, or local service pages? Your page format should match.
- Read the first two sentences of each ranking page. If they answer the query directly and yours doesn’t, that’s your rewrite target.
- Check your meta title and description against the page’s actual content. A mismatch between what Google shows in the SERP and what the visitor finds on the page causes an immediate exit.
- Look at your page’s average time on page in GA4. Under 30 seconds on a content-heavy page means visitors aren’t reading past the opening.
Content formatting rules that keep visitors reading
- Lead with a direct answer in the first two to three sentences. Don’t bury the point.
- Use descriptive H2 and H3 subheadings that tell the visitor what each section covers before they read it.
- Keep paragraphs short: three to five sentences maximum. White space is not wasted space.
- Bold key phrases so scanners can extract value without reading every word.
- Add at least one visual element (image, table, or diagram) per major section.
Neil Patel’s guidance on reducing bounce rate frames this as the most impactful long-term strategy: audit the top SERP results, match the format, and answer the query in the opening sentences.
The Semrush “three Cs” framework is a practical editorial checklist: every high-bounce page should be clear (one obvious topic), concise (no padding), and compelling (a reason to keep reading). Run any high-bounce page through those three questions before publishing a rewrite.
For service pages specifically, optimizing your service page for Google means aligning the page’s structure and copy with the specific query type your ideal customer uses, not a generic keyword.
Step 4: Where should you place CTAs and internal links?
A visitor who finishes reading your page and finds nothing to do next will leave. That’s a bounce you could have prevented with a single well-placed link or button.
Best practices for CTAs:
- One primary CTA per page. Multiple competing CTAs create decision paralysis. Pick one goal per page.
- Repeat it three times. Above the fold (before the visitor scrolls), mid-page (after the main value proposition), and at the bottom (after the full argument is made).
- Use action-oriented language. “Get a free quote” outperforms “Contact us.” “See how it works” outperforms “Learn more.”
- Minimize form fields. Every additional field reduces completion rates. For a first-touch CTA, name and email (or just a phone number) is enough.
For internal links, NN/g research is clear: contextual links placed inside paragraphs, where they’re relevant to the sentence around them, outperform generic footer links and sidebar widgets. A “related posts” block at the end of a blog article works well; a list of links in the footer that no one reads does not.
Pro Tip: On a service page, add a “You might also want to know” section near the bottom with two or three links to related service pages or FAQs. This is the highest-converting internal link placement for local service businesses, because it catches visitors who aren’t ready to call but want to keep researching.
A well-structured service page layout makes this natural. The role of service page structure in getting leads covers exactly how to sequence content so visitors flow toward a CTA rather than hitting a dead end.
Step 5: What technical fixes and trust signals reduce immediate exits?
A visitor who hits a 404 page, a broken image, or an SSL warning leaves immediately and doesn’t come back. These are the easiest fixes on the list and the most embarrassing to leave unaddressed.
Technical checklist:
- Fix 404 errors. Use Google Search Console’s Coverage report to find pages returning 404s. Redirect them to the correct URL or a relevant page.
- Repair broken images. A page with missing images looks abandoned. Scan with a tool like Screaming Frog or Broken Link Checker.
- Resolve SSL / mixed-content warnings. Any page loading HTTP assets on an HTTPS site triggers a browser warning. Fix by updating asset URLs to HTTPS or using a relative URL.
- Test forms on mobile. A contact form that doesn’t submit on iOS or Android is a silent conversion killer. Test every form on at least two mobile browsers.
- Pop-up rules. Avoid entry popups entirely on mobile. Use exit-intent triggers (desktop only), time-delayed triggers (minimum 30 seconds on page), or scroll-depth triggers (after 50% scroll). Make the close button obvious and large enough to tap.
Trust signals to add above the fold:
- A short testimonial snippet (one sentence, with a name and city)
- A client logo strip or certification badge
- A “Secure checkout” or SSL badge on any page with a form or payment element
These signals don’t require a redesign. A single testimonial sentence and a badge added to the header area of a service page can measurably reduce exits, particularly for visitors arriving from paid search who don’t yet know your brand.
Step 6: How do you measure improvements and know they’re working?
Making changes without measuring them is guesswork. Set up a simple measurement plan before you start, so you know whether a change worked or just happened at the same time as a traffic shift.
Key metrics to track in GA4
- Engagement rate (inverse of bounce rate): your primary KPI.
- Average engagement time per session: a proxy for content quality and intent match.
- Pages per session: rising pages per session means internal links and CTAs are working.
- Conversion rate for the page goal: the ultimate measure of whether lower bounce translates to business results.
- LCP, INP, CLS: track these in PageSpeed Insights or Google Search Console’s Core Web Vitals report after each performance change.
A/B testing basics
- Write a single hypothesis: “Changing the headline from X to Y will increase engagement rate because it matches the search intent of visitors from organic search.”
- Pick one KPI to measure.
- Run the test for at least two full business cycles (typically two to four weeks) to account for day-of-week traffic variation.
- Don’t call a winner until you have enough sessions to be statistically meaningful. For most small business sites, that means at least 200–300 sessions per variant.
Quick-win experiments to run first:
- Headline rewrite on your highest-traffic service page
- Moving the primary CTA above the fold
- Removing an entry popup
- Adding a contextual internal link block at the bottom of a high-bounce blog post
How to interpret results without false positives
Segment every result by source and device. A 10-point improvement in engagement rate that comes entirely from a new paid campaign, not from organic visitors, isn’t a page improvement. Watch for traffic volume changes during the test period: a sudden spike from a viral social post will skew every metric. Use Hotjar session recordings to confirm that the behavior change you expected (more scroll depth, more CTA clicks) is actually happening.
What does the research say about speed and content clarity?
The evidence for prioritizing speed is strong and specific.
Stat: Google’s research, as reported by Verlua, shows that moving from a 1-second load time to 3 seconds increases bounce probability by roughly 32%. At 5 seconds, that probability rises by around 90%. Sites loading in 1 second can see bounce rates near 7%; at 5 seconds, that figure climbs to around 38%.
That’s not a marginal difference. A site that takes 5 seconds to load on mobile is operating with a structural disadvantage that no amount of content optimization fully compensates for.
Beyond speed, the content clarity framework that holds up across multiple studies is the “three Cs” from Semrush: clear, concise, compelling. Applied to a high-bounce page, it works as a three-question audit:
- Clear: Does the page have one obvious topic, stated in the headline?
- Concise: Is every paragraph earning its place, or is there padding that makes visitors give up?
- Compelling: Is there a reason to keep reading, a hook, a promise, a specific benefit?
Improving user engagement over the long term comes down to this combination: fast delivery of content that matches intent, structured so visitors can extract value quickly and find a natural next step.
The practical takeaway from the research: combining core fixes (speed, intent alignment, mobile UX, and clear CTAs) commonly yields a 20–30% reduction in bounce rate across many sites. That’s not a guarantee, but it’s a realistic target for a site that currently has obvious problems in two or more of those areas.
Timeboxed implementation checklist
Use this as the handoff document for your developer or designer. Tasks are ordered by impact-to-effort ratio.
Quick wins (hours to one day, owner or developer):
- Run PageSpeed Insights and GTmetrix; save the reports as your baseline
- Compress and convert all images above the fold to WebP
- Enable browser caching and GZIP via hosting control panel or caching plugin
- Fix all 404 errors found in Google Search Console
- Remove entry popups on mobile
- Add a contextual internal link to your top three high-bounce pages
Medium effort (one to three days, developer):
- Enable a CDN (Cloudflare free tier is a practical starting point)
- Defer non-critical JavaScript and move render-blocking scripts to footer
- Fix mobile tap targets and font sizes flagged by Lighthouse
- Resolve SSL / mixed-content warnings
- Rewrite headlines and opening paragraphs on your top two service pages to match search intent
Longer-term work (one to four weeks, developer and designer):
- Upgrade hosting if TTFB consistently exceeds 600ms
- Implement lazy loading for all below-the-fold images
- Redesign CTA placement on key service pages using a tested layout
- Set up A/B tests on headline variants for highest-traffic pages
| Task | Effort | Role | Expected impact window |
|---|---|---|---|
| Image compression to WebP | 1–2 hours | Owner / developer | Days |
| Enable caching / CDN | 2–4 hours | Developer | Days |
| Fix 404s and broken images | 2–4 hours | Owner | Days |
| Rewrite page headlines | 4 hours | Owner / designer | 1–2 weeks |
| Defer non-critical JS | 4 hours | Developer | Days |
| Upgrade hosting (if TTFB > 600ms) | 1–2 days | Developer | Days |
| Mobile UX fixes (tap targets, font) | 1–2 days | Developer | 1–2 weeks |
| A/B test CTA placement | 2–4 weeks | Designer / owner | 2–4 weeks |
Tasks like image compression, caching, and 404 fixes can be rolled out permanently without testing. CTA placement, headline copy, and pop-up timing benefit from A/B testing before a permanent change.
Key Takeaways
Combining speed fixes, intent-matched content, and clear CTAs is the most reliable path to a measurably lower bounce rate for small business websites.
| Point | Details |
|---|---|
| Speed is the first fix | Target LCP under 2.5s; a 1s-to-5s load time increase correlates with a ~90% rise in bounce probability. Sites loading in 1 second can see bounce rates near 7%; at 5 seconds, that figure climbs to around 38%. |
| Diagnose before you build | Segment GA4 by source and device before rewriting or redesigning anything. |
| Intent match drives long-term gains | Audit the top five SERP results for your keyword and match your page format and opening sentences to what’s ranking. |
| Measure for at least two weeks | Run A/B tests for two to four weeks and segment results by source to avoid false positives. |
| Webby Website Optimisation | Offers speed optimization, service page CRO, and WordPress performance work for local service businesses. |
The bounce rate fix most businesses skip
Most site owners focus on the wrong variable. They redesign the homepage, add a chatbot, or swap out the hero image, and then wonder why the bounce rate barely moved. The reason is almost always the same: they skipped the diagnostic step.
The pages that drive the most business value for a local service company are rarely the homepage. They’re the specific service pages that rank for “plumber in [city]” or “accountant near me.” Those pages get traffic from people with genuine purchase intent, and a 70% bounce rate on them is a direct revenue problem.
What actually works, based on the evidence in this article, is unglamorous: fix the server response time, compress the images, rewrite the headline to match what the visitor searched for, and put a phone number or form above the fold. Small changes, like a headline tweak, a single contextual link, or removing an entry popup, often outperform large redesigns when the root cause is intent mismatch.
The three Cs framework (clear, concise, compelling) is worth printing and taping to a monitor. It’s a faster editorial review than any SEO audit tool, and it catches the most common reason visitors leave: the page doesn’t quickly tell them they’re in the right place.
One more thing worth saying plainly: a bounce rate of 60% on a blog post is not a crisis. Chasing a lower number on pages where a single-page visit is a successful outcome wastes time that could go toward fixing service pages where the bounce rate actually costs you money.
Webby Website Optimisation can audit and fix your bounce rate
If your service pages are losing visitors before they convert, the problem is almost always one of three things: slow load time, a headline that doesn’t match what the visitor searched for, or no clear next step above the fold. Webby Website Optimisation fixes all three, specifically for local service businesses that need results without a months-long agency engagement.
The work covers WordPress speed optimization (image compression, caching, CDN setup, TTFB fixes), service page restructuring for conversion, and technical error cleanup. For businesses that need a full rebuild, the website design and development service delivers a performance-ready site built around your specific service area and customer intent. If you want a faster path, the website built in a day option gets a conversion-ready presence live quickly.
Start with a free performance and bounce-rate audit: Webby Website Optimisation will identify your top three fixable issues and give you a prioritized action list. Contact the team at webby.net.au to get started.
Useful tools for diagnosing and fixing bounce rate
- Google Analytics 4 (GA4): Use Reports → Engagement → Landing page to find high-bounce pages. Filter for 100+ sessions, then segment by source and device to identify the root cause.
- Google PageSpeed Insights / Lighthouse: Run this first on every page you plan to fix. It gives a prioritized list of performance issues with estimated time savings. Target LCP under 2.5s, INP under 200ms, CLS under 0.1.
- WebPageTest: Use for multi-location testing and throttled mobile connection tests. The Connection View tab shows TTFB clearly, which tells you whether the bottleneck is server-side or front-end.
- Hotjar: Set up heatmaps and session recordings on your top three high-bounce pages. Watch ten recordings per page to confirm whether visitors are seeing your CTA, where they drop off, and whether rage clicks indicate a broken element.
- GTmetrix: Use the waterfall chart to identify which specific resources (images, scripts, fonts) are causing the longest load delays. Useful alongside PageSpeed Insights for a second opinion on priorities.
For a deeper look at UX improvements that support both engagement and search rankings, the partner resource on enhancing user experience for SEO covers the overlap between UX decisions and organic performance.
Next step: run PageSpeed Insights on your highest-traffic service page right now, then open GA4 and pull the landing page report for the last 30 days. Those two reports will tell you where to start. If you want a professional eye on the results, reach out to Webby Website Optimisation for a no-cost audit.