
Core Web Vitals are three field metrics, Largest Contentful Paint, Interaction to Next Paint, and Cumulative Layout Shift, and your page passes when each one scores “good” at the 75th percentile of real visits. Check your Search Console Core Web Vitals report or run PageSpeed Insights on your top pages right now to see where you stand.
TL;DR:
- Most websites need a good LCP under 2.5 seconds, a fast INP below 200 milliseconds, and CLS under 0.1 to pass Core Web Vitals.
- Slow server responses, unoptimized images, and late-loading fonts are common causes of poor LCP, especially if they affect one or multiple key pages.
- Long JavaScript tasks and unpredefined sizes for images or iframes heavily impact INP and CLS, requiring ongoing monitoring and incremental fixes.
- Field data from search tools like Search Console and CrUX show real visitor experiences, but lab tools like PageSpeed Insights help identify specific resource delays.
- Continuous testing and updates are necessary because interactions, third-party scripts, and content changes can reintroduce performance issues over time.
Table of Contents
- What LCP, INP, and CLS actually measure
- Which tools to use for field data, lab tests, and your own monitoring
- How to find and reproduce a failing page
- Prioritized fixes for LCP, INP, and CLS
- Verifying fixes and catching regressions early
- A WordPress maintainer’s take on keeping scores healthy
- Why INP needs ongoing attention, not a one-time fix
- Where Core Web Vitals fit in your broader priorities
- Get a technical audit instead of guessing where to start
- FAQ
- Sources
What LCP, INP, and CLS actually measure
Largest Contentful Paint (LCP) tracks how long it takes the largest visible image, text block, or video to render in the viewport. A good LCP score is 2.5 seconds or less; anything render-blocking, like a slow server or an unoptimized hero image, pushes this number up, and the metric can shift mid-load if a late-arriving font or image becomes the new largest element.
Interaction to Next Paint (INP) measures how quickly your page responds to clicks, taps, and keyboard input across the entire visit, not just the first interaction. A good score sits at 200 milliseconds or less, and it reports your worst significant interaction rather than an average.
Cumulative Layout Shift (CLS) is a unitless score for how much visible content jumps around as the page loads. A good score is 0.1 or less, and the usual culprits are images without dimensions, late-loading ads, and injected banners.
Statistic: All three thresholds are evaluated at the 75th percentile of page visits, meaning three out of four real visitors need a “good” experience before Google calls the page a pass. That single rule explains why a page can feel fast to you in testing and still fail in Search Console.
A few edge cases trip people up consistently:
- Content inside an iframe (ads, embeds) can affect CLS and LCP but is often invisible in basic lab audits.
- Web fonts that swap in late can recalculate LCP after the page appears finished.
- Single-page apps need special handling since a route change does not trigger a full page load.
- Lab tools estimate performance under fixed conditions; field data reflects whatever device and connection your actual visitors used.
Which tools to use for field data, lab tests, and your own monitoring
Field and lab tools answer different questions, and mixing them up wastes time.
- Use Search Console’s Core Web Vitals report and CrUX to see how real visitors experienced your live pages over the last 28 days, grouped by URL pattern.
- Use PageSpeed Insights and Lighthouse for a lab-based breakdown of what is slowing a specific page down, including render-blocking resources and long tasks.
- Use the web-vitals JavaScript library to collect your own real-user monitoring (RUM) data when CrUX does not have enough traffic for your pages, or when you need granular, per-session detail web.dev recommends for production tracking.
- Use Chrome DevTools’ Performance panel to trace long tasks and layout shifts on your own machine.
CrUX requires a minimum level of public traffic to include a URL, so smaller sites or password-protected pages often will not show up there at all, which is exactly when your own RUM instrumentation becomes necessary rather than optional.
How to find and reproduce a failing page
Diagnosis works best as a narrowing funnel: start broad with field data, then get specific in the lab.
- Pull your failing URL groups from the Search Console Core Web Vitals report and rank them by organic traffic or conversion value, since a slow checkout page deserves attention before a slow archive page.
- Run PageSpeed Insights on the worst offenders to see which resource, script, or layout element is dragging down each metric, then cross-check against any RUM traces you have for the same URLs.
- Reproduce the issue in Lighthouse or DevTools by throttling the network and CPU to mobile-like conditions, capturing long tasks for INP problems, and watching the Layout Shift Regions overlay to pinpoint exactly which element is moving for CLS.
Pro Tip: Filter your Search Console report by device before you start fixing anything; mobile and desktop often fail for completely different reasons, and treating them as one problem wastes engineering time.
Prioritized fixes for LCP, INP, and CLS
Fix in order of traffic impact, not alphabetical order.
For LCP, the highest-leverage moves are cutting server response time (TTFB), inlining critical CSS, preloading the hero image or font, serving properly sized images in modern formats like WebP or AVIF, and putting static assets behind a CDN.
For INP, break up long JavaScript tasks with requestIdleCallback or manual yielding, code-split so pages only load the JavaScript they need, defer anything non-essential (chat widgets, analytics beacons), and instrument real interactions so you know which buttons or menus are actually slow rather than guessing.
For CLS, reserve space for every image and iframe with explicit width and height attributes or the aspect-ratio CSS property, load ads into pre-sized containers, and never insert new content above something the user is already looking at.
- Quick wins: image dimensions, font preloading, deferring third-party scripts.
- Medium effort: code-splitting, critical CSS extraction, CDN migration.
- Deep engineering: server-side rendering changes, database query optimization, third-party script governance.
Pro Tip: Estimate ROI by multiplying the traffic on a failing page group by how far it sits from the threshold; a page at 2.6 seconds LCP with heavy traffic is a better use of a sprint than a page at 6 seconds with almost none.
Verifying fixes and catching regressions early
Search Console and CrUX report on a rolling 28-day window, so a fix deployed today will not fully register there for roughly four weeks. Use PageSpeed Insights or your own RUM dashboard for a faster signal within a day or two of shipping a change, then confirm the field data once the window catches up.
- Set up a RUM dashboard (built on the web-vitals library) that flags regressions by URL group, not just site-wide averages.
- Add synthetic Lighthouse checks to your CI/CD pipeline so a pull request that tanks LCP gets caught before merge, not after.
- Gate releases on critical pages (checkout, lead forms) with a performance budget rather than relying on manual review.
- Build a monthly Core Web Vitals audit into your existing SEO or dev standup, not as a separate fire drill.
A WordPress maintainer’s take on keeping scores healthy
On WordPress sites, the repeat offenders are almost always the same: an uncached PHP response, a bloated plugin stack, unoptimized media, and no CDN. A working checklist covers caching, a plugin and theme audit to remove anything idle, an image pipeline that compresses and resizes on upload, and a CDN sitting in front of static assets, the same fundamentals covered in our WordPress speed optimization checklist.
- Run a monthly Core Web Vitals check and a deeper quarterly audit on your highest-traffic templates.
- Prioritize template-level fixes (the product page, the homepage) over one-off post fixes, since a single template change touches hundreds of URLs at once.
Why INP needs ongoing attention, not a one-time fix
INP is different from the metric it replaced, First Input Delay, because it does not just score your visitor’s first click. It records the worst significant interaction across the entire page visit, which means a menu that works fine on page load but freezes after a user scrolls through a long article will still drag your score down.
That makes INP a moving target. A single fix to one button rarely clears the metric for the whole page, because the next worst interaction simply takes its place in the measurement. Improving INP in practice means auditing multiple interaction points: search boxes, filters, add-to-cart buttons, accordions, and anything that fires JavaScript on click or keypress, then reducing the main-thread work behind each one.

New features and new third-party scripts reintroduce the problem over time. A marketing team adding a live chat widget or a new personalization script can quietly push your INP score back into “needs improvement” months after you fixed it. Treat INP the way you would treat site security: something you check on a recurring basis rather than something you cross off a list once.
Where Core Web Vitals fit in your broader priorities
Core Web Vitals matter most on your highest-traffic, conversion-critical pages, where even a small drop in speed affects revenue. They are one input among several, so weigh them alongside content quality, navigation clarity, and overall UX rather than chasing a perfect score at the expense of everything else. The best results come from developers, product teams, and SEO specialists treating measurement as a shared, recurring habit rather than a one-time project.
— Steve Doig
Get a technical audit instead of guessing where to start
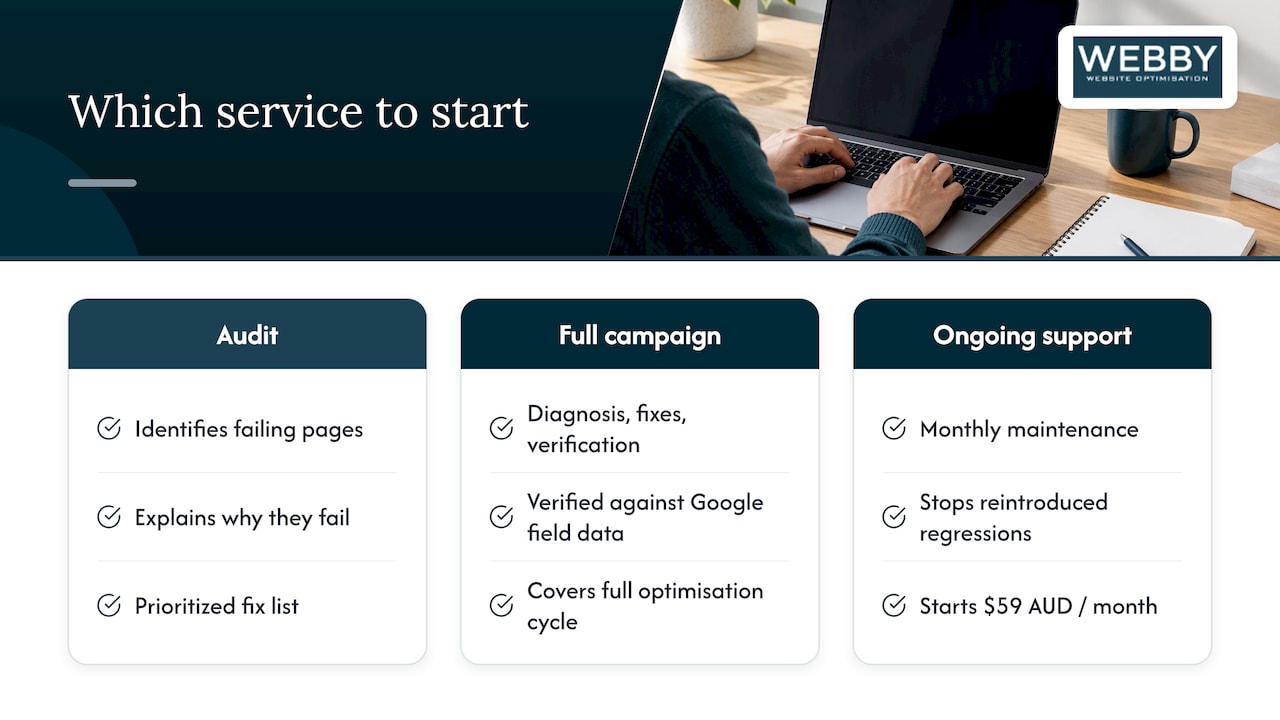
Chasing Core Web Vitals across dozens of templates, plugins, and third-party scripts eats time that most small teams do not have, and misreading lab data versus field data leads to fixes that look good in Lighthouse but never move the Search Console report. We run a dedicated Website Audit that identifies exactly which pages are failing, why, and in what order to fix them, so your team or ours can act on a prioritized list instead of a generic checklist.
For sites that need both the audit and the engineering work done, our Business Website Optimisation Campaign covers the full cycle: diagnosis, fixes, and verification against the same field data Google uses to score your site. And if your WordPress site just needs ongoing attention so new plugins and content updates stop reintroducing regressions, our WordPress Help & Support plans start with Monthly Maintenance at $59 AUD per month.
Reach out for a quote on whichever route fits your site, a one-time audit or ongoing support, and get a clear answer on where your pages stand.
FAQ
How to pass Core Web Vitals assessment?
A page passes when LCP, INP, and CLS all reach a “good” rating at the 75th percentile of real visits over a 28-day window. Check the Core Web Vitals report in Search Console, which pulls this data from CrUX, to see your current pass or fail status by URL group.
What is a good Core Web Vitals score?
A good score means LCP at 2.5 seconds or less, INP at 200 milliseconds or less, and CLS at 0.1 or less. Scores above these thresholds but below the “poor” cutoffs fall into a “needs improvement” range.
What is Core Web Vitals in simple words?
Core Web Vitals are three measurements of how a real visitor experiences your page: how fast the main content appears, how quickly the page responds to a click or tap, and how much the layout jumps around while loading. Google uses these measurements as one signal in how it evaluates page experience for search.
How do I check Core Web Vitals?
Open the Core Web Vitals report in Search Console for field data on your live pages, or run PageSpeed Insights on an individual URL for both field data and a lab-based diagnosis. For pages without enough traffic to appear in CrUX, use the web-vitals JavaScript library to collect your own real-user data.